
Despite limited positive movements witnessed in the Dow Jones Industrial Average on Wall Street yesterday, the index continues to maintain negative stability.
Technical Analysis Insights:
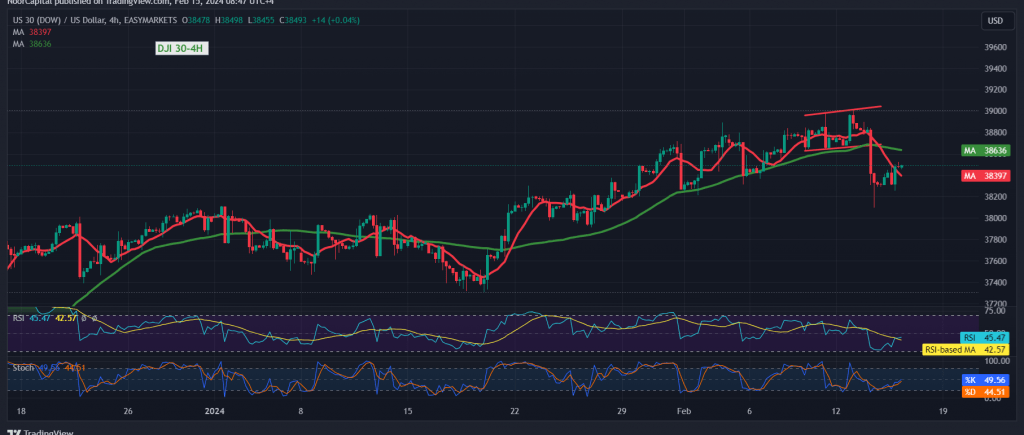
Analyzing the 4-hour chart, it’s apparent that the simple moving averages are exerting downward pressure on the price from above. This is accompanied by indications of declining momentum on short time frames, signaling potential weakness in the market.
Likely Scenario:
With daily trading persisting below the resistance level of 38,590, the downward trend remains the most probable for today’s trading session. Initial targets for this downward movement are set at 38,320 and subsequently 38,150. The resistance level of 38,590 holds significant importance in the short term, and a breach below it could extend the losses, potentially leading to a touch of 38,050.
Potential Reversal Scenario:
However, a return to trading stability above 38,590 would invalidate the proposed bearish scenario. In such a scenario, the index may attempt to recover, with initial targets set at 38,690.
Warnings Amid Economic Data Releases:
Traders should exercise caution as high-impact economic data is expected from both the British and US economies today. Key data points include monthly gross domestic product figures, retail sales, unemployment benefits, and the New York State manufacturing index. The release of these data may result in increased price fluctuations in the Dow Jones Industrial Average.
Conclusion:
Given the prevailing technical indicators and the potential impact of economic data releases, traders should remain vigilant and adjust their trading strategies accordingly to navigate the market volatility effectively.
Note: Trading on CFDs involves risks. Therefore, all scenarios may be possible. This article is not a recommendation to buy or sell but rather an explanatory reading of the price movement on the chart.
| S1: |