
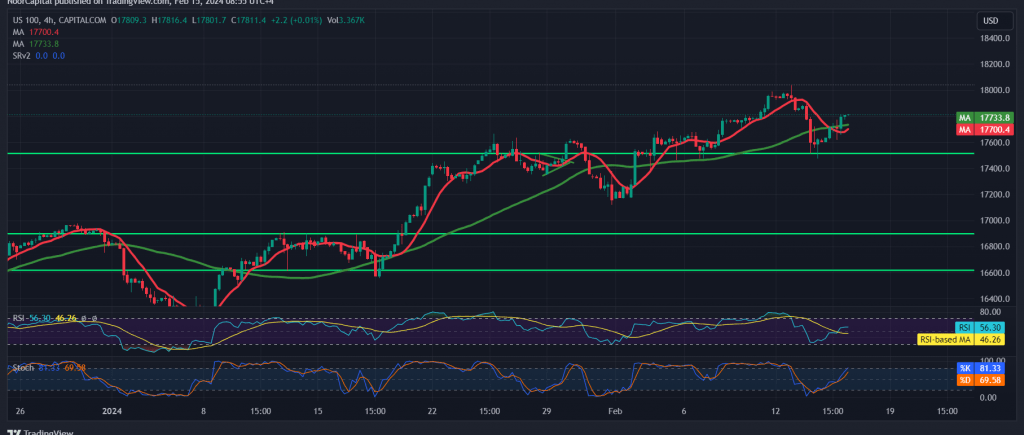
During the American trading session, the Nasdaq index experienced an upward trend, reaching its peak at 17,816.
Technical Analysis Overview:
Today’s technical analysis leans towards a negative outlook for trading, primarily focusing on stability below the previously broken support level, now converted into a resistance level, at 17,840. Furthermore, maintaining trading below 17,880, coupled with the negative pressure exerted by the 50-day simple moving average, reinforces the bearish sentiment. Clear signals of negativity are also observed on the Stochastic indicator.
Likely Bearish Scenario:
Given the technical indicators, the possibility of a decline remains significant. Initial targets for this downward movement are set at 17,665, with a break below this level potentially accelerating the strength of the downward trend. In such a scenario, the path could open directly towards 17,520, with further losses extending towards 17,450.
Reversal Potential:
However, a return to trading stability above 17,880 would invalidate the bearish scenario. In such a scenario, the index may regain its bullish momentum and aim towards the target level of 17,960.
Warnings and Cautionary Notes:
Traders should be aware that the quality of transactions may not be high given the prevailing market conditions. Additionally, high-impact economic data releases from the British and US economies, including monthly gross domestic product figures, retail sales, unemployment benefits, and the New York State manufacturing index, may lead to increased price fluctuations.
Conclusion:
With the Nasdaq index showing signs of negativity amidst a temporary upward trend, traders should remain cautious and closely monitor key support and resistance levels to navigate potential market volatility effectively.
Note: Trading on CFDs involves risks. Therefore, all scenarios may be possible. This article is not a recommendation to buy or sell but rather an explanatory reading of the price movement on the chart.
| S1: |