Dow Jones Industrial Average (DJIA) Technical Analysis
Positive price action has dominated the movements of the Dow Jones Industrial Average on the New York Stock Exchange, with the index registering an intraday high of 51,890.
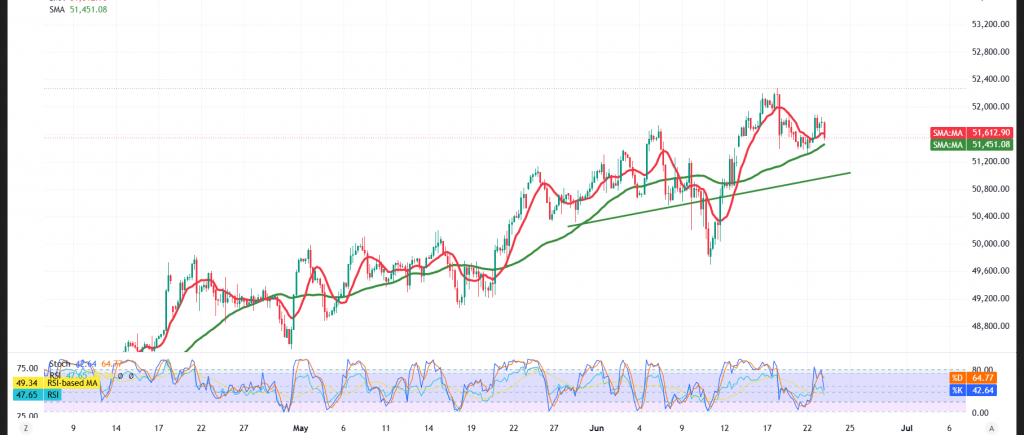
Technical Outlook for Today’s Session – 4-Hour Timeframe:
With respect to intraday dynamics, the simple moving averages have returned to provide support beneath the price and are working to lift prices higher — a configuration that lends support to an upward bias across the coming hours.
The Relative Strength Index (RSI) is likewise displaying signals that lean constructively, mirroring the attempts at a relative improvement in bullish momentum.
Bullish (Most Likely) Scenario:
Sustained trading above the 51,370 support floor preserves the continuation of the upside move, with targets set at:
- 51,850 as the initial objective
- Followed by 52,160 as the subsequent level
Bearish Scenario:
Conversely, a confirmed breakdown beneath 51,260 would expose the index to renewed negative pressure, with targets emerging at:
- 50,985
- Followed by 50,680
Risk Alert: Risk levels remain elevated amid persistent trade frictions and geopolitical tensions — all scenarios should be considered plausible.
Trading in CFDs involves risks, and therefore all scenarios are subject to potential outcomes. The analysis provided above is not a recommendation to buy or sell but rather an illustrative reading of price action on the chart.
| S1: 51260 | R1: 51850 |
| S2: 50985 | R2: 52165 |
| S3: 50675 | R3: 52445 |