
Gold (XAU/USD) Technical Analysis
Gold prices continued to grapple with intense selling pressure across recent trading sessions, unfolding as part of a broad-based decline that drove the precious metal to a low of $4,268 per ounce — a move that underscores the persistence of the short-term bearish trend.
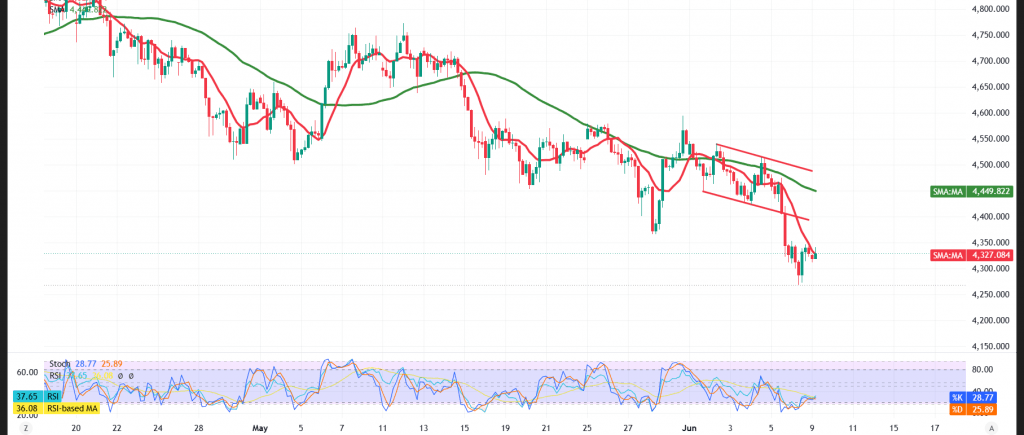
Technical Outlook – 4-Hour Timeframe:
Prices are currently consolidating beneath the $4,400 mark, mirroring the persistent weakness in buying momentum and the dominance of sellers across the market.
From a technical standpoint, prices remain anchored below the simple moving averages, which continue to exert downward pressure and function as dynamic resistance barriers. Compounding this picture, trading persists within a descending price channel and along a descending trendline — a configuration that lends further weight to the continuation of the negative trajectory.
Beyond that, the current recovery attempts lack sufficient momentum to validate a genuine trend reversal. Any potential rallies at this stage are more likely to represent temporary corrective swings within the broader downtrend, unless prices manage to decisively breach the key resistance levels.
Bearish (Most Likely) Scenario:
Sustained trading beneath the $4,366 resistance ceiling preserves the bearish bias, with the initial target set at:
- $4,280
A decisive break below this level — coupled with sustained trading beneath it — would amplify selling pressure and pave the way toward:
- $4,232 as the subsequent objective
Bullish Scenario:
This scenario would only be validated should gold deliver a decisive and convincing break above the $4,366 resistance and sustain trading above it — a development that would supply prices with the technical impetus to recoup a portion of the losses and target:
- $4,402 as the initial upside objective
Risk Alert: Risk levels remain elevated amid persistent trade frictions and geopolitical tensions — all scenarios should be considered plausible.
Risk Disclaimer: Trading CFDs involves risks, and therefore all scenarios may be plausible. The content above is not a recommendation to sell or buy but rather an explanatory reading of price movement on the chart.
| S1: 4280.00 | R1: 4366.00 |
| S2: 4232.00 | R2: 4402.00 |
| S3: 4195.00 | R3: 4451.00 |


