
EUR/USD Technical Analysis
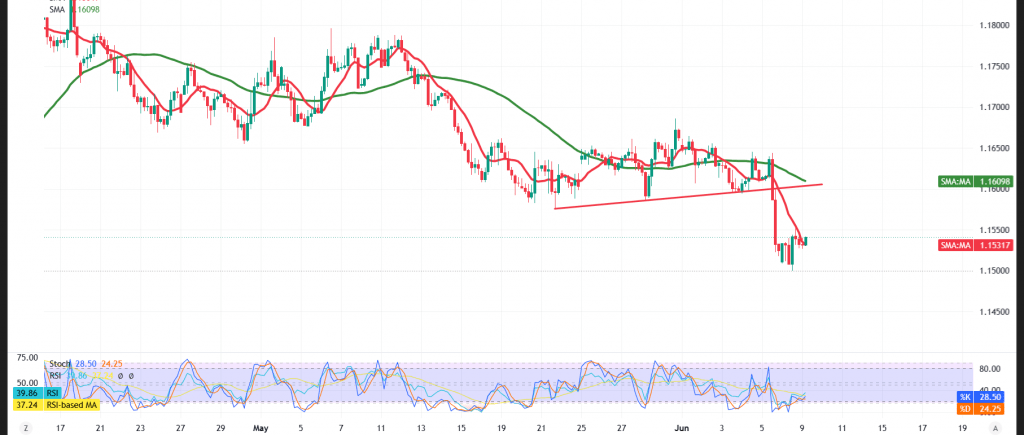
The EUR/USD pair continued to grapple with selling pressure during the previous session, gradually retreating from the psychological barrier at 1.1600 — a development that mirrors the persistent weakness in bullish momentum and the dominance of the short-term downtrend.
Technical Outlook – 4-Hour Timeframe:
Across intraday price action, the pair remains anchored beneath the simple moving averages, which continue to function as effective dynamic resistance. This dynamic reinforces the negative pressure and lends support to the continuation of the downward trajectory over the current period.
At the same time, the Relative Strength Index (RSI) has started to broadcast renewed negative signals, coinciding with the emergence of a bearish crossover. This configuration mirrors the deterioration in buying momentum and the entrenched dominance of sellers across the price action.
Compounding this picture, the pair’s inability to reclaim trading above the key resistance levels strengthens the probability of sustained selling pressure across the upcoming sessions.
Expected Scenarios:
Bearish (Most Likely) Scenario:
As long as trading remains capped below the pivotal 1.1570 resistance ceiling, the prospects of a resumption of the downtrend will remain firmly on the table — particularly should the price confirm a decisive break beneath 1.1500 and sustain trading below it — with targets set at:
- 1.1475 as the initial objective
- Followed by 1.1430 as the subsequent target
Bullish Scenario:
Conversely, a confirmed hourly candle close above 1.1570 would supply the pair with a temporary corrective upside impulse, with:
- 1.1620 emerging as the initial target
- Risk Disclaimer: Trading CFDs involves risks, and therefore the scenarios outlined above are not a recommendation to sell or buy but rather an explanatory reading of price movement on the chart.
| S1: 1.1510 | R1: 1.1560 |
| S2: 1.1470 | R2: 1.1590 |
| S3: 1.1420 | R3: 1.1630 |


