
US crude oil prices failed to hold onto their recent gains after colliding with the pivotal resistance at $95.40 — a level that successfully capped the advance and forced prices into a bearish corrective wave, with the contract registering an intraday high of $95.43 per barrel.
Technical Outlook – 4-Hour Timeframe:
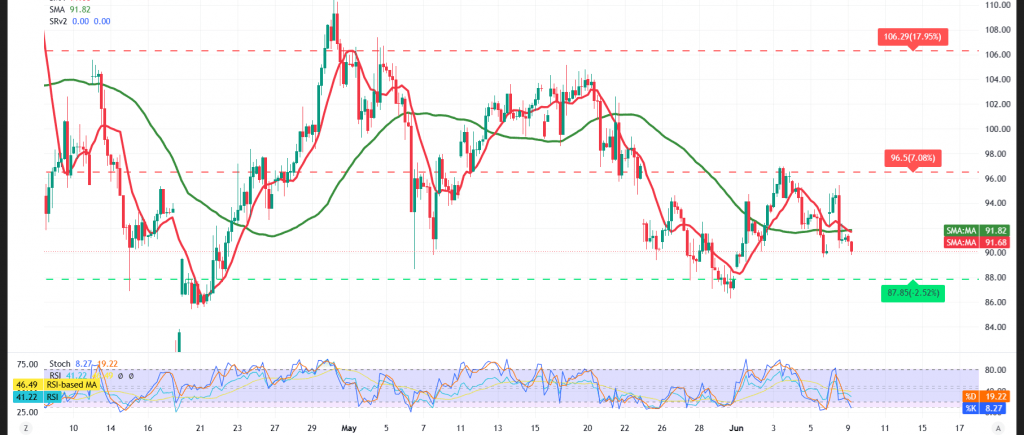
With respect to intraday dynamics, the $95.40 resistance zone managed to temporarily halt the bullish momentum, compelling prices to drift within a negative range as selling pressure resurfaced.
The simple moving averages have likewise returned to weigh on the price from above, functioning as dynamic resistance and capping the prospects of a swift recovery over the short term.
On the flip side, the Relative Strength Index (RSI) continues to broadcast negative signals across the shorter timeframes, coinciding with the continuation of trading along a descending trendline — a configuration that mirrors the weakness in bullish momentum at the present juncture.
That said, the current declines should still be classified as a temporary corrective move within the broader uptrend, unless the key support levels are decisively breached.
Expected Scenarios:
Bearish (Most Likely) Scenario:
Should intraday trading remain capped beneath the $91.90 resistance, the bearish bias is likely to retain the upper hand, with the initial target set at:
- $88.20
Bullish Scenario:
Conversely, a sustained recovery and stabilization above the $91.90 level would compel prices to resume the upside trajectory at a more accelerated pace, with:
- $93.70 emerging as the initial upside target
Disclaimer: Trading oil carries substantial risk and may not be suitable for all investors.
Risk Alert: Risk levels remain elevated amid persistent trade frictions and geopolitical tensions — all scenarios should be considered plausible.
Trading in CFDs involves high risk, and therefore all scenarios are subject to potential outcomes. The analysis provided above is not a recommendation to buy or sell but rather an illustrative reading of price action on the chart.
| S1: 93.55 | R1: 96.80 |
| S2: 92.00 | R2: 98.50 |
| S3: 90.30 | R3: 100.05 |


