 Noor Trends News, Technical Analysis, Educational Tools and Recommendations

GBP/USD Technical Analysis
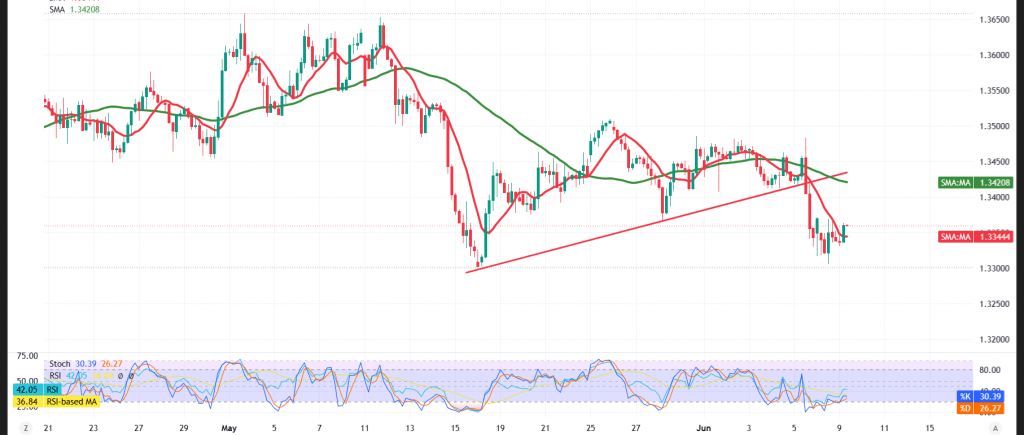
The GBP/USD pair came under sustained selling pressure during the previous session, sliding to an intraday low of 1.3305.
Technical Outlook – 4-Hour Timeframe:
On the short-term horizon, the simple moving averages continue to function as effective dynamic resistance, imposing downward pressure on the price and reinforcing the short-term bearish bias.
Meanwhile, the Relative Strength Index (RSI) is broadcasting renewed negative signals, mirroring the weakness in buying momentum and the gradual return of control to the sellers’ camp. This dynamic raises the probability of sustained downward pressure across the upcoming sessions.
Compounding this picture, the price’s inability to breach the key resistance reinforces the prospects of a resumption of the downtrend as long as trading remains capped beneath this pivotal resistance ceiling.
Expected Scenarios:
Bearish (Most Likely) Scenario:
As long as trading remains capped below the 1.3370 resistance ceiling, the downward bias will retain the upper hand, with 1.3300 set as the initial target. A decisive break beneath this level would unlock the path toward further declines targeting 1.3275 as the subsequent objective.
Bullish Scenario:
Conversely, a decisive breakout above the 1.3370 resistance would temporarily reignite the uptrend, with 1.3390 emerging as the initial target, followed by 1.3420 as the subsequent level.
Risk Alert: Risk levels remain elevated amid persistent trade frictions and geopolitical tensions — all scenarios should be considered plausible.
Trading CFDs involves risks, and therefore all scenarios may be plausible. The information provided above is not a recommendation to sell or buy but rather an explanatory reading of price movement on the chart.
| S1: 1.3320 | R1: 1.3390 |
| S2: 1.3275 | R2: 1.3420 |
| S3: 1.3230 | R3: 1.3460 |