
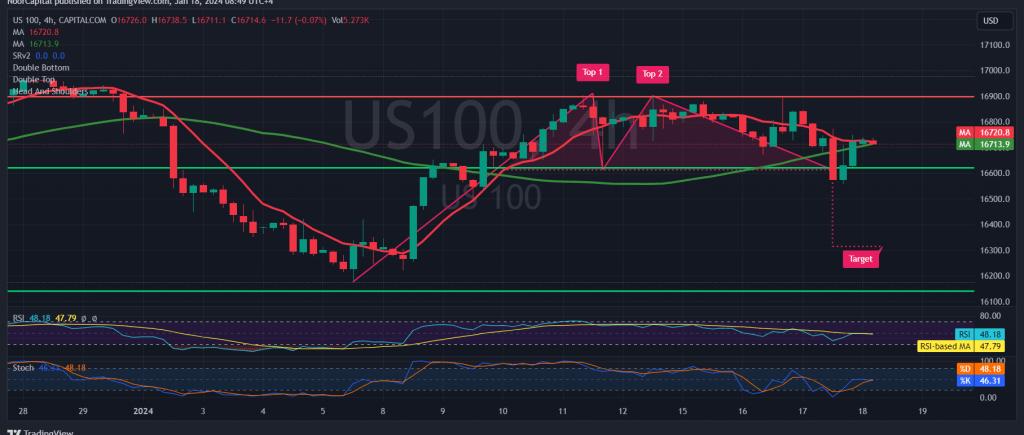
In the preceding trading session, the Nasdaq index successfully reached the targeted bearish levels at the price of 16560, hitting its lowest point at 16557.
Analyzing the technical aspects today, the index initiated a modest upward rebound following the interaction with the robust support represented by the 16560 target. Examining the 4-hour chart, the index is attempting to establish stability above the 50-day simple moving average. Conversely, indications of negativity are emerging on the Stochastic indicator, signaling a gradual loss of upward momentum.
Given these conflicting technical signals, a prudent approach is to observe the price behavior for the emergence of one of the following scenarios:
- To resume the downward trend, it’s crucial to witness sustained trading below the resistance level of 16750. Additionally, a breakthrough of 16670 would facilitate a visit to 16610 and 16570.
- An upward trend necessitates the closing of an hourly candle above 16750, potentially providing an opportunity for a retest of 16860.
Warning: The risk level is high amid ongoing geopolitical tensions, and heightened price volatility may be witnessed.
Note: Trading on CFDs involves risks. Therefore, all scenarios may be possible. This article is not a recommendation to buy or sell but rather an explanatory reading of the price movement on the chart.
| S1: |