
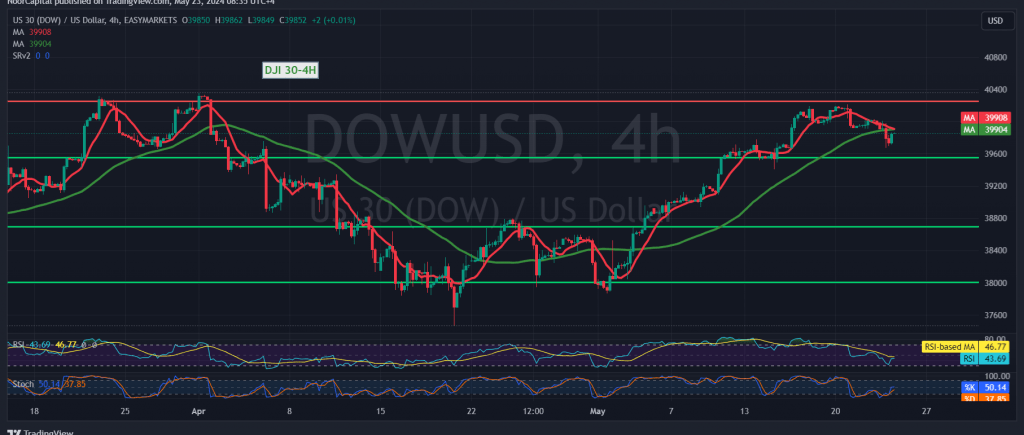
The Dow Jones Industrial Average (DJIA) reversed its upward trend following the recent Federal Reserve Committee meeting, resulting in significant losses. As previously indicated, stability below the 39940 level presented an opportunity for the index to retest 39390, with the lowest recorded level at 39670.
Today’s technical indicators suggest potential further downside:
- Simple Moving Averages (SMA): The SMAs are acting as a resistance, hindering upward momentum.
- Relative Strength Index (RSI): The RSI is providing negative signals, indicating potential bearish momentum.
Given these indicators, the potential for a downward trend is strong, provided intraday trading remains below the 39920 resistance level. Key targets to watch are:
- 39680: The immediate support and first target.
- 39500: Breaking 39680 would likely accelerate the downward momentum towards this level.
Should the index close at least one hourly candle above 39920, the downward trend may be postponed. In this case, the index could retest:
- 40030: The next resistance level before determining the subsequent price direction.
Economic Data and Market Volatility:
Today’s market may experience increased volatility due to the release of significant economic data from major economies, including:
- France and Germany: Preliminary readings of the Services and Manufacturing PMI indices.
- United Kingdom: Preliminary reading of the Services and Manufacturing PMI indices.
- United States: Preliminary reading of the Services and Manufacturing PMI indices.
High geopolitical tensions continue to pose significant risks, potentially leading to substantial price fluctuations.
Risk Warning
Traders should be aware that risks are high and may not be proportional to the expected returns. Effective risk management strategies are essential in the current market environment.
Note: Trading on CFDs involves risks. Therefore, all scenarios may be possible. This article is not a recommendation to buy or sell but rather an explanatory reading of the price movement on the chart.
| S1: |