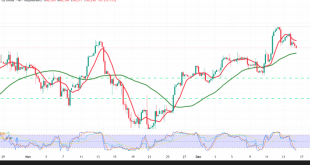
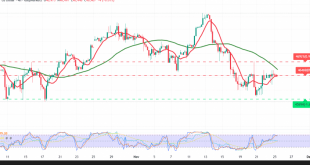
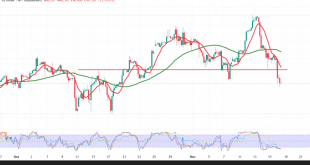
An upward trend continues to dominate the Dow Jones Industrial Average, reaching a high of 48,183. Technical Outlook – 4-Hour Timeframe: The 50-period Simple Moving Average (SMA) continues to support the broader daily uptrend and provides positive momentum for price movements. The Relative Strength Index (RSI) is also generating positive …
Read More »Dow Jones extends its gains 5/12/2025
The Dow Jones Industrial Average (DJIA) extended its gains on Wall Street, reaching a high of 48,131. Technical Outlook – 4-Hour Timeframe: The 50-period Simple Moving Average (SMA) continues to support the prevailing upward trend and provides additional positive momentum. The Relative Strength Index (RSI) is also delivering positive signals, …
Read More »Dow Jones receives positive signals 3/12/2025
The Dow Jones Industrial Average (DJIA) extended its gains on Wall Street, reaching a high of 47,671. Technical Outlook – 4-Hour Timeframe: The 50-period Simple Moving Average (SMA) continues to support the broader upward trend and provides consistent positive momentum. The Relative Strength Index (RSI) is also delivering positive signals, …
Read More »Dow Jones Seeks Clear Signals to Resume Its Upward Path 25/11/2025
The Dow Jones Industrial Average traded with a positive bias on Wall Street, posting a high of 46,655. Technical Outlook – 4-Hour Timeframe The 50-period Simple Moving Average (SMA) continues to support the prevailing daily uptrend, reinforcing the bullish structure. At the same time, the RSI is attempting to generate …
Read More »Dow Jones Extends Losses 21/11/2025
The index extended losses as mapped in the prior view: the 46,260 break unlocked 46,140, then sellers pressed toward 45,785/45,780. Technical outlook 50-SMA (4H): Rolling over above price as a descending ceiling, reinforcing the broader downtrend. RSI: Firmly negative, adding to downside pressure. Base case (bearish while below 46,230) Maintaining …
Read More »Dow Jones catches its breath 20/11/2025
After several down sessions, the index attempted a rebound, reaching a 46,516 high. Technical outlook 50-SMA (4H): Rolling over above price as a descending ceiling, consistent with the broader daily downtrend. RSI: Trying to stabilize around the 50 line, but positive momentum is not yet confirmed. Trade map (wait for …
Read More »Dow Jones Deepens Its Losses 19/11/2025
The index logged sharp losses in the week’s first session, posting a 46,397 low. Technical outlook 50-SMA (4H): Rolling over above price and acting as a descending ceiling (dynamic resistance), reinforcing the daily downtrend. RSI: Remains negative despite oversold readings, underscoring strong near-term bearish momentum. Base case (bearish while below …
Read More »Dow Jones breaks key support 18/11/2025
The index logged sharp losses in the week’s first session, posting a 46,397 low. Technical outlook 50-SMA (4H): Rolling over above price and acting as a descending ceiling (dynamic resistance), reinforcing the daily downtrend. RSI: Remains negative despite oversold readings, underscoring strong near-term bearish momentum. Base case (bearish while below …
Read More »Dow Jones Caught Between Trend and Correction 14/11/2025
The Dow Jones Industrial Average (DJI30) suffered sharp losses on Wall Street, impacted by widespread profit-taking after a record-breaking rally. Technical Outlook for Today’s Session – 4-Hour Timeframe: The 50-period Simple Moving Average (SMA) supports the upward trend and acts as a support level, attempting to push the price higher. …
Read More »Dow Jones extends its gains 12/11/2025
The index pushed to a record high at 48,089. Technical outlook 50-SMA (4H): Trending beneath price, reinforcing the uptrend as dynamic support. RSI: Remains constructive, signaling scope for further upside. Base case (bullish continuation) A clean break/hold above 48,090 would likely extend gains toward 48,300, then 48,470. Alternative / pullback …
Read More »
Noor Trends News, Technical Analysis, Educational Tools and Recommendations