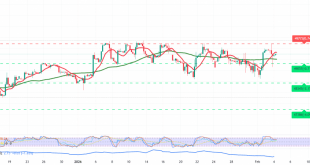
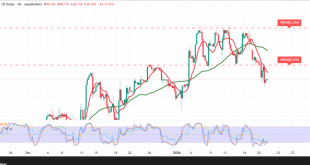
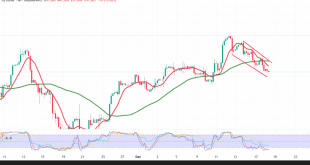
The Dow Jones Industrial Average successfully reached the second upside target outlined in the previous technical report at 50,560, extending gains to a session high near 50,610. Technical Outlook – 4-Hour Chart Price action continues to trade above the simple moving averages, which supports the broader recovery structure. However, momentum …
Read More »Dow Jones Records a Price Jump 10/2/2026
The Dow Jones Industrial Average posted a historic advance, closing above the 50,000 level for the first time ever and reaching a peak near 50,323, underscoring strong bullish momentum. Technical Analysis – 4-Hour Chart Price action continues to trade comfortably above the simple moving averages, supporting the continuation of the …
Read More »Dow Jones Faces a Temporary Loss of Momentum 4/2/2026
The Dow Jones Industrial Average successfully reached its first upside target at 49,640, as outlined in the previous technical report, extending gains to a session high near 49,767. Technical Outlook – 4-Hour Chart Price action remains supported above the simple moving averages, which continues to favor the broader recovery scenario. …
Read More »Dow Jones starts positively 3/2/2026
The Dow Jones Industrial Average posted a strong advance on Wall Street, registering notable gains and climbing to a high near 49,602. Technical Outlook – 4-Hour Chart Price action remains supported above the simple moving averages, reinforcing the potential for continued recovery. This constructive setup is further backed by positive …
Read More »Dow Jones faces negative pressure 21/1/2026
The Dow Jones Industrial Average gave up its recent gains, with the previous session dominated by selling pressure that pushed the index down to a low near 48,611. Technical Outlook – 4-Hour Chart Price action remains capped below the simple moving averages, significantly reducing the likelihood of a near-term recovery. …
Read More »Dow Jones Sees a Bullish Technical Rebound 16/1/2026
The Dow Jones Industrial Average found firm support near the 49,290 level, prompting a technical rebound and stabilizing price action. Technical Outlook – 4-Hour Chart Price holding above the 50-period Simple Moving Average continues to favor the bullish structure. In addition, the Relative Strength Index (RSI) has returned to positive …
Read More »Dow Jones gives up its gains 14/1/2026
The Dow Jones Industrial Average came under notable selling pressure in the previous session, retreating on Wall Street after a series of consecutive gains. Technical Outlook – 4-Hour Chart The pullback reflects profit-taking following the index’s advance toward the 49,900 area. Simple moving averages have shifted back into a bearish …
Read More »Dow Jones May Signal Further Gains 13/1/2026
The Dow Jones Industrial Average continues to post strong gains on Wall Street, closing above the 49,550 level and reinforcing the prevailing bullish momentum. Technical Outlook – 4-Hour Chart The 50-period Simple Moving Average (SMA) remains supportive, acting as a dynamic floor for price action and confirming the persistence of …
Read More »Dow Jones: The negative pressure may continue 18/12/2025
The Dow Jones Industrial Average extended its downward trend in line with our negative outlook, reaching the targeted level of 48,145 and recording a low of 47,818. Technical Outlook for Today’s Session – 4-Hour Timeframe: The 50-period Simple Moving Average (SMA) is now exerting clear downward pressure, reinforcing the short-term …
Read More »Dow Jones may experience downward pressure 16/12/2025
The Dow Jones Industrial Average posted losses during the previous trading session after reaching a high of 48,745. Technical Outlook – 4-Hour Timeframe: The 50-period Simple Moving Average (SMA) has started to apply downward pressure on the index, increasing short-term negative momentum. At the same time, the Relative Strength Index …
Read More »
Noor Trends News, Technical Analysis, Educational Tools and Recommendations