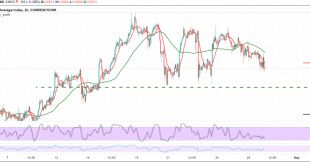
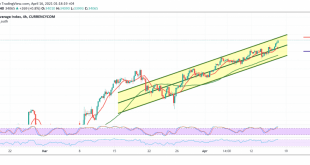
The Dow Jones Industrial Average declined in the New York Stock Exchange during the previous trading session, after hitting the resistance level of 33,870. Despite the bearish bias, the index managed to settle above the support level published during the previous report, located at 33,660, and we find that the …
Read More »Dow Jones Retest Support
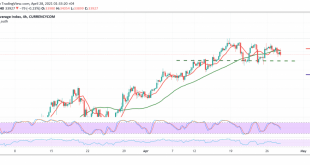
The Dow Jones Industrial Average declined during the previous trading session after finding a strong resistance level around 33,970 as the current moves witnessed stability above the sub-support level of 33,760. On the technical side today, and despite the downside moves, the RSI indicator is still providing positive signals in …
Read More »Dow Jones Settled Above Support
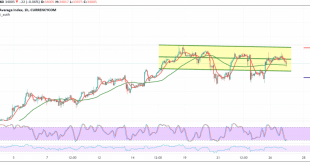
The Dow Jones Industrial Average traded positively during the previous trading session on Wall Street, recording its highest levels of 34,042. On the technical side today, the upside bias is still in place, with the index price stabilizing above the 33,790 support level, accompanied by the clear positive signs on …
Read More »Dow Jones Reiterates Nullish Chances
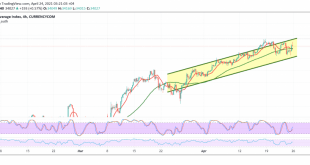
The Dow Jones Industrial Average jumped, ending last week’s trading with a noticeable increase, posting its highest price during last Friday’s trading 34,053. On the technical side today, we are biased towards the positivity, relying on the price building a base above 33,680, accompanied by positive signs that began to …
Read More »Dow Jones Breaks Through Support, Negativity Remains
Significant negative trades dominated the Dow Jones Industrial Average on the New York Stock Exchange, recording its lowest level during the previous session’s trading, 33,603. On the technical side today, and with a closer look at the 60-minute chart, we find the RSI continues to defend the downside, and this …
Read More »Dow Jones Continues Touching Descending Targets
The Dow Jones Industrial Average declined significantly during the previous trading session within the expected bearish path mentioned in the previous analysis, touching the official target station at 33,780, recording its lowest price 33,570. On the technical side, we notice that there is a clear breach of the support level …
Read More »Dow Jones May See a Temporary Decline
Negative trades dominated the Dow Jones Industrial Average on Wall Street during the previous trading session, to settle for recording its highest level around the 34,050 resistance level. On the technical side, today we find negative signs appearing on Stochastic, accompanied by negative signs coming from the RSI. From here, …
Read More »Dow Jones Continues to Achieve Our Bullish Goals
A noticeable push for the Dow Jones Industrial Average, as we expected during the last analysis, touching the official target station located at the price of 34,140, recording the highest of 34,141. On the technical side today, we tend to be positive, depending on the price intraday above 34,000 and …
Read More »Dow Jones Maintains a Bullish Path
Positive trading returned to dominate the movements of the Dow Jones Industrial Average at the New York Stock Exchange after it succeeded in surpassing the resistance level of 33,800, indicating that this would immediately stop the bearish tendency and lead the index to the official bullish path with an initial …
Read More »Dow Jones May Have a Temporary Fall
The Dow Jones Industrial Average touched the first target required to be achieved during the previous analysis, at 33,710, recording a high of 33,797. On the technical side today, we believe that there is a possibility of a negative bias during the coming hours, depending on the negative signs that …
Read More » Noor Trends News, Technical Analysis, Educational Tools and Recommendations

