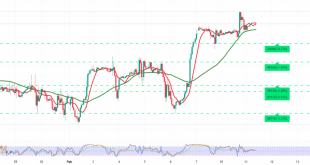
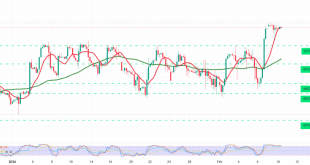
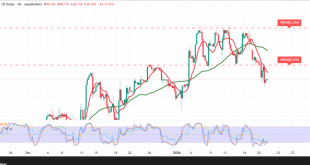
The Dow Jones Industrial Average successfully reached the second upside target outlined in the previous technical report at 50,560, extending gains to a session high near 50,610. Technical Outlook – 4-Hour Chart Price action continues to trade above the simple moving averages, which supports the broader recovery structure. However, momentum …
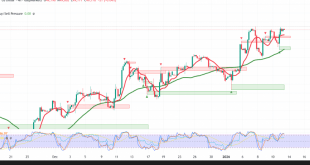
Read More »Dow Jones Retests Support 11/2/2026