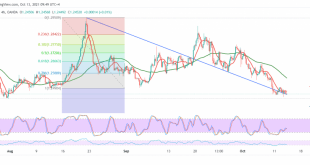
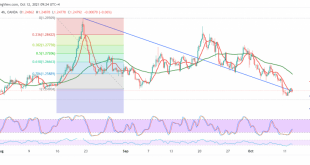
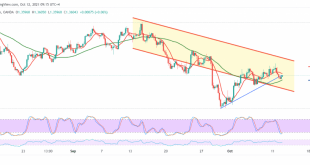
The Canadian dollar achieved noticeable gains during the previous session’s trading, heading towards the awaited bullish correction tendency at 1.2410, to extend its gains, touching a high at 1.2530. Technically, and with the pair’s success in confirming the breach of 1.2410, the 61.80% Fibonacci retracement, which has now turned into …
Read More »The Pound Continues to Achieve Bearish Targets
Oil, Crude, trading
Read More »Crude Oil Breaks Support And May Witness a Bearish Corrective Slope
Oil, Crude, trading
Read More »The Euro Extends Its Losses Against The Dollar.
The bearish trend continues to dominate the euro’s movements against the US dollar within the expected negative outlook in the last report, touching the official target at 1.1780. Technically, and with careful consideration on the 4-hour chart, we find the 50-day simple moving average that continues to pressure the price …
Read More »The Euro Near a 3-Month Low After German Data
The euro traded near a three-month low against the dollar on Wednesday after German data raised doubts about the strength of the economic recovery, while the US currency awaited the minutes of the Federal Reserve’s latest meeting. The single European currency was trading at $1.1820, after touching a three-month low …
Read More »Dow Jones Keeps Bullish Tone
Oil, Crude, trading
Read More »CAD Facing Downward Pressure
The Canadian dollar intraday movements witnessed a modest bearish bias after several consecutive sessions of ascending within the bullish correction, which touched 1.2410. Technically, the current trading is stable intraday below the resistance level of 1.2330/1.2340, 50.0% Fibonacci level, with the simple moving averages pressuring the price from above. Therefore, …
Read More »Sterling Kicks Off on a Positive Note
Oil, Crude, trading
Read More »Crude Oil Prices Keep Rallying
Oil, Crude, trading
Read More »The Euro Hovers around Resistance Levels
The single European currency kicked off the weekly trading on a slightly bullish slope, aiming to retest the resistance level 1.1880/1.1890. Technically speaking, the 4-hour chart shows that the stochastic is trading around overbought levels, with trading stabilized below the 1.1880/1.1890 resistance level, 61.80% Fibonacci level. Therefore, the bearish scenario …
Read More »