
GBP/USD Technical Analysis
The GBP/USD pair successfully reached the initial target outlined in our previous technical report at 1.3440, printing an intraday high of 1.3443.
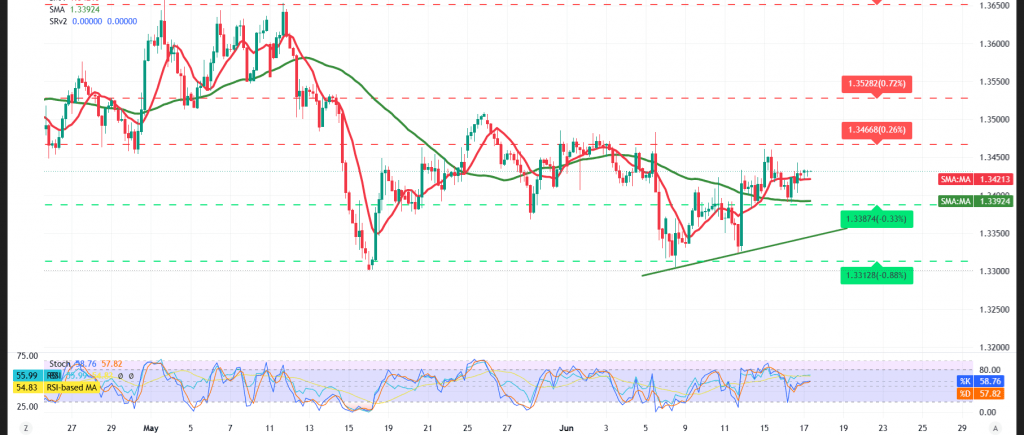
Technical Outlook – 4-Hour Timeframe:
Across intraday price action, the simple moving averages continue to function as effective dynamic support, holding the price steady and containing potential downside — a configuration that strengthens the prospects of a renewed uptrend across the upcoming period.
On the flip side, the Relative Strength Index (RSI) is broadcasting positive signals across the shorter timeframes after pushing decisively into oversold territory relative to the price action — a reading that points to the potential formation of a fresh momentum base capable of supporting the ongoing recovery attempts.
Compounding this constructive picture, sustained trading above the key support floors preserves the positive outlook, particularly given the continued failure of sellers to assert complete control over the pair’s price action.
Expected Scenarios:
Bullish (Most Likely) Scenario:
As long as trading remains anchored above the 1.3400 support floor, the bullish trend will retain the upper hand, with the initial target set at:
- 1.3450
A decisive break above this level would pave the way for further gains toward:
- 1.3480 as the subsequent level
- With potential further extension toward 1.3510
Bearish Scenario:
Conversely, a decisive breakdown beneath 1.3400 would reassert the downward trend, with targets emerging at:
- 1.3375 as the initial objective
- Followed by 1.3340 as the subsequent level
Key Economic Events to Watch:
Markets are bracing for a slate of pivotal US economic releases and events today, including:
United States:
- Federal Reserve Interest Rate Decision
- FOMC Statement
- Fed Economic Projections
- Federal Reserve Chair’s Press Conference
Accordingly, markets are likely to experience elevated volatility and sharp price swings around the release of these data points — a backdrop that could fuel accelerated technical moves in both directions.
Risk Alert: Risk levels remain elevated amid persistent trade frictions and geopolitical tensions — all scenarios should be considered plausible.
Trading CFDs involves risks, and therefore all scenarios may be plausible. The information provided above is not a recommendation to sell or buy but rather an explanatory reading of price movement on the chart.
| S1: 1.3375 | R1: 1.3450 |
| S2: 1.3340 | R2: 1.3490 |
| S3: 1.3305 | R3: 1.3515 |


