
US Crude Oil (WTI) Technical Analysis
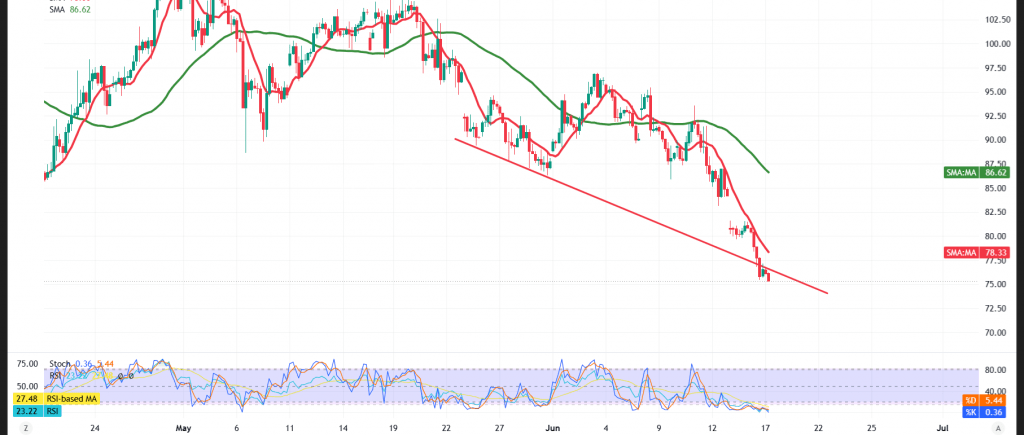
US crude oil futures sustained sharp losses during yesterday’s trading, surpassing all the negative targets outlined in our previous technical report. Prices decisively breached the $78.80 floor to extend their decline, registering an intraday low of $75.39 per barrel during early trading.
Technical Outlook – 4-Hour Timeframe:
With respect to intraday dynamics, oil is attempting to catch its breath and claw back a limited portion of its recent losses, drawing support from a relative improvement in momentum indicators in the wake of a powerful selling wave that drove prices into deeply oversold territory.
The Relative Strength Index (RSI) has likewise started to broadcast positive signals that could contribute to taming the pace of the decline over the short term — though these signals remain insufficient to alter the overarching downtrend.
In contrast, the simple moving averages continue to weigh on prices from above, functioning as dynamic resistance zones that cap recovery opportunities and preserve the negative pressure intact.
Compounding this picture, the continuation of trading beneath a descending trendline represents a major technical hurdle standing in the way of a fully fledged recovery wave, keeping the prospects of sustained selling pressure firmly on the table unless prices succeed in decisively breaching the pivotal resistance levels and consolidating above them.
Expected Scenarios:
Bearish (Most Likely) Scenario:
Sustained intraday trading beneath the $79.50 resistance ceiling (previously broken support) preserves the advantage of the downtrend, with the initial target set at:
- $73.40
A decisive break below this level — coupled with sustained trading beneath it — would extend the losses toward:
- $71.40 as the subsequent level
Bullish Scenario:
Conversely, a sustained recovery and stabilization above the $79.50 level would compel prices to recoup their losses, with:
- $80.90 emerging as the initial upside target
Key Economic Events to Watch:
Markets are bracing for a slate of pivotal US economic releases and events today, including:
United States:
- Federal Reserve Interest Rate Decision
- FOMC Statement
- Fed Economic Projections
- Federal Reserve Chair’s Press Conference
Accordingly, markets are likely to experience elevated volatility and sharp price swings around the release of these data points — a backdrop that could fuel accelerated technical moves in both directions.
Disclaimer: Trading oil carries substantial risk and may not be suitable for all investors.
Risk Alert: Risk levels remain elevated amid persistent trade frictions and geopolitical tensions — all scenarios should be considered plausible.
Trading in CFDs involves high risk, and therefore all scenarios are subject to potential outcomes. The analysis provided above is not a recommendation to buy or sell but rather an illustrative reading of price action on the chart.
| S1: 73.40 | R1: 79.50 |
| S2: 71.35 | R2: 83.55 |
| S3: 67.30 | R3: 85.60 |


