
In the latest trading session, US crude oil futures contracts notched a significant milestone by hitting the initial target set at $74.00, culminating in a peak of $74.24 per barrel.
Technical Analysis: Moving Averages and Relative Strength Index Signal Positivity
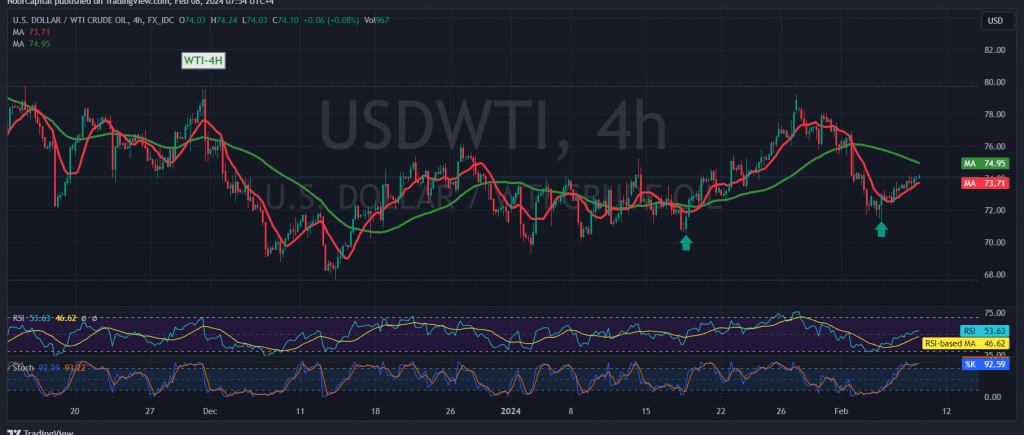
A technical analysis reveals that simple moving averages are exerting a positive influence, ascending from below to bolster prices. This favorable development coincides with upbeat signals from the relative strength index (RSI), which maintains stability above the 50 midline, further underpinning the bullish sentiment.
Projected Trajectory: Upholding Support for Continued Upside Momentum
With trading activity sustaining above the critical support level of $73.50, the path of least resistance appears to favor further upward movement throughout the day. The immediate target lies at $74.50, with upward momentum gaining traction. Moreover, a decisive leap above $74.50, coupled with price consolidation, strengthens the daily upward trend, potentially propelling oil prices towards $74.85 initially, with potential extensions towards $75.40.
Potential Reversal Scenario and Risk Considerations
It’s essential to monitor the support level closely, as any dip below $73.50 could disrupt the envisioned scenario, subjecting oil prices to downward pressure. In such a scenario, the initial target for downside movement stands at $72.85.
Warning: Heightened Risk Amid Geopolitical Uncertainties
Traders should exercise caution, acknowledging the elevated risk level amidst ongoing geopolitical tensions, which may spur heightened price volatility. Employing robust risk management strategies is crucial to navigate potential fluctuations effectively.
By integrating these technical insights and risk considerations, traders can better position themselves to capitalize on the dynamic movements within the US crude oil futures market.
Note: Trading on CFDs involves risks. Therefore, all scenarios may be possible. This article is not a recommendation to buy or sell but rather an explanatory reading of the price movement on the chart.
| S1: |