
Gold (XAU/USD) Technical Analysis
Gold prices successfully harvested notable gains at the start of this week’s trading, unfolding as part of clear attempts to recoup previous losses, with the yellow metal printing an intraday high of $4,369 per ounce — a move underpinned by the return of demand and an improvement in risk appetite toward the precious metal.
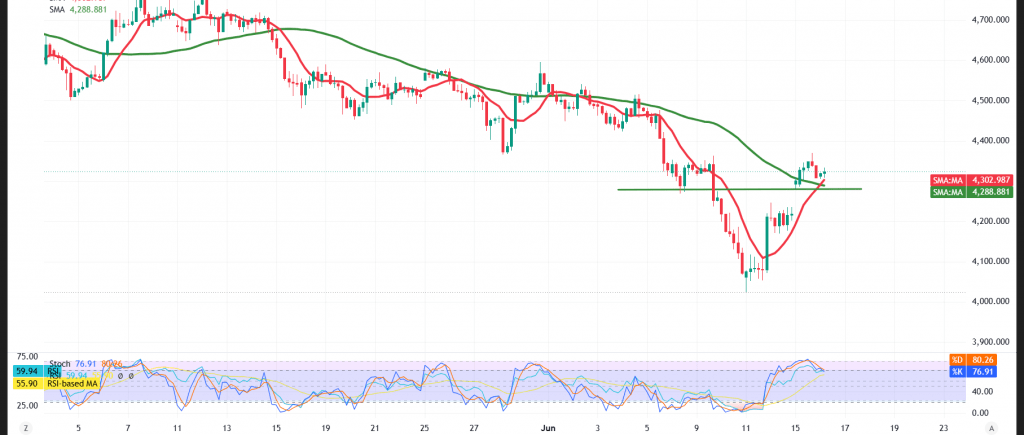
Technical Outlook – 4-Hour Timeframe:
Recent price action has witnessed a limited downward bias, which is best viewed as a natural development within the framework of profit-taking activity following the previous powerful rally — particularly as the Relative Strength Index (RSI) pushed decisively into overbought territory, prompting prices to retreat temporarily in order to rebuild momentum.
From a technical standpoint, prices remain anchored above the simple moving averages, which continue to fulfill their role as dynamic support zones — a configuration that lends weight to the hypothesis of a continuation of the bullish corrective wave over the short term.
Sustained trading above the key support floors preserves the constructive outlook and frames any current declines as temporary corrective swings within a broader upward trajectory.
Expected Scenarios:
Bullish (Most Likely) Scenario:
Sustained intraday trading above the $4,279 support floor preserves the advantage of the uptrend, with the initial target set at:
- $4,368
Should the price successfully breach this level and sustain trading above it, the pace of gains could accelerate toward:
- $4,413 as the subsequent objective
Bearish Scenario:
This scenario would only be validated should gold deliver a decisive breakdown beneath the $4,279 support and sustain trading below it — a development that would expose the price to renewed negative pressure, with:
- $4,235 emerging as the initial downside target
Disclaimer: Trading gold carries substantial risk and may not be suitable for all investors.
Risk Alert: Risk levels remain elevated amid persistent trade frictions and geopolitical tensions — all scenarios should be considered plausible.
Risk Disclaimer: Trading CFDs involves risks, and therefore all scenarios may be plausible. The content above is not a recommendation to sell or buy but rather an explanatory reading of price movement on the chart.
| S1: 4280.00 | R1: 4370.00 |
| S2: 4235.00 | R2: 4413.00 |
| S3: 4190.00 | R3: 4457.00 |


