
US Crude Oil (WTI) Technical Analysis
US crude oil prices have mounted limited attempts to recover from their recent losses after registering lows near $79.74 per barrel, unfolding as part of a short-term technical correction in the wake of the recent downside trend.
Technical Outlook – 4-Hour Timeframe:
Across intraday price action, oil is working to claw back a portion of its losses, drawing support from a relative improvement in momentum indicators. The Relative Strength Index (RSI) has started to display positive signals that could underpin a continued technical rebound over the coming hours.
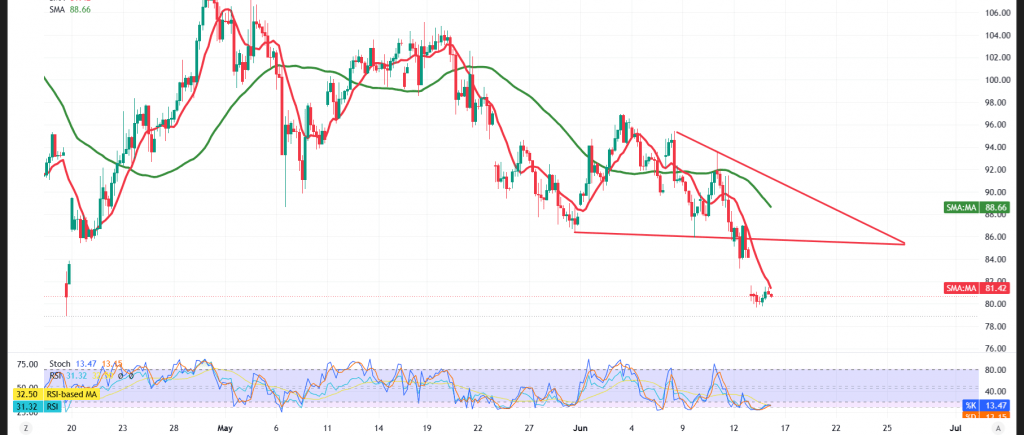
That said, prices remain anchored beneath the simple moving averages, which continue to function as effective dynamic resistance barriers — a configuration that diminishes the prospects of upside movement and caps the contract’s ability to deliver a robust and sustained recovery.
Compounding this picture, the continuation of trading beneath the descending trendline represents a major technical hurdle standing in the way of a fully fledged recovery, keeping the prospects of renewed selling pressure firmly on the table unless prices succeed in decisively breaching and sustaining trading above the key resistance levels.
Expected Scenarios:
Bearish (Most Likely) Scenario:
Should intraday trading remain capped below the $81.60 resistance ceiling, the downward trend will retain the upper hand, with the initial target set at:
- $79.75
A decisive break below this level — coupled with sustained trading beneath it — would extend the losses toward:
- $78.80 as the subsequent objective
Bullish Scenario:
Conversely, a sustained recovery and stabilization above the $81.60 level would compel prices to resume the upside trajectory at a more accelerated pace, with:
- $82.50 emerging as the initial upside target
Disclaimer: Trading oil carries substantial risk and may not be suitable for all investors.
Risk Alert: Risk levels remain elevated amid persistent trade frictions and geopolitical tensions — all scenarios should be considered plausible.
Trading in CFDs involves high risk, and therefore all scenarios are subject to potential outcomes. The analysis provided above is not a recommendation to buy or sell but rather an illustrative reading of price action on the chart.
| S1: 79.75 | R1: 81.60 |
| S2: 78.80 | R2: 82.55 |
| S3: 77.80 | R3: 83.50 |


