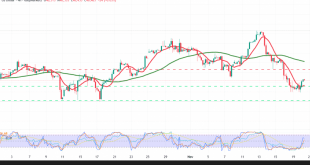
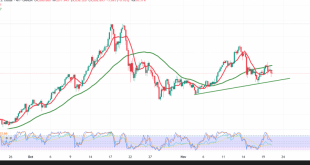
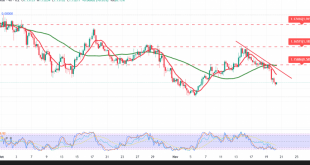
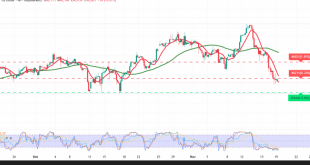
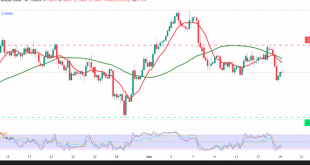
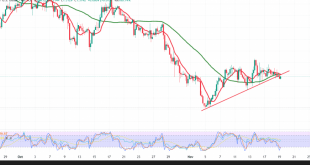
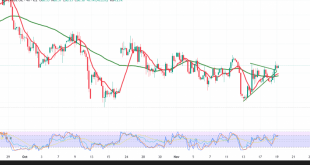
After several down sessions, the index attempted a rebound, reaching a 46,516 high. Technical outlook 50-SMA (4H): Rolling over above price as a descending ceiling, consistent with the broader daily downtrend. RSI: Trying to stabilize around the 50 line, but positive momentum is not yet confirmed. Trade map (wait for …
Read More »CAD Anchors at Support 20/11/2025
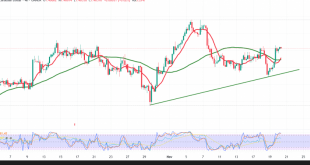
USD/CAD staged a bullish rebound after defending the 1.4000 psychological floor. Technical outlook SMAs: Have turned higher beneath price, adding constructive momentum. RSI: Prints positive signals, aligning with further upside attempts. Base case (bullish while above 1.4000) Holding 1.4000 keeps the topside favored. A clean break/4H close above 1.4065 would …
Read More »Pound Outlines a Bearish Turn 20/11/2025
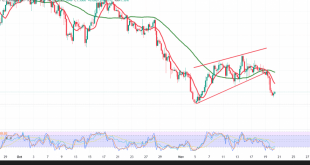
Sterling extended losses in line with our prior view, breaking 1.3075 and printing a 1.3038 low. Technical outlook SMAs: Sitting overhead as dynamic resistance, curbing rebound attempts. RSI / pattern: Momentum remains negative and a bearish structure persists, reinforcing the daily downtrend. Base case (bearish continuation) A decisive break/4H close …
Read More »Oil Gives Back Its Gains 20/11/2025
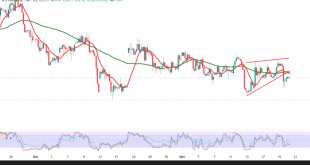
WTI reversed lower after failing to hold above $60.00, sliding to a $58.70 low. Technical outlook 50-SMA (4H): Price is trading below the average, adding downside pressure. Pattern/structure: A developing bearish setup (with lower highs) supports continuation risk to the downside. Base case (bearish while below $60.00 / $60.45) A …
Read More »Dollar Deals a Blow to Gold as Eyes Turn to the Jobs Report 20/11/2025
Gold faded after a $4,132 spike in U.S. hours, sliding to $4,038 as sellers regained control. Technical outlook SMAs: Overhead and acting as dynamic resistance, likely capping recovery attempts. RSI: Continues to flash negative momentum, underscoring weak upside follow-through. Base case (bearish while below $4,110 / $4,117) Maintaining trade below …
Read More »Euro Hits the Target Zone 20/11/2025
The pair extended its slide in line with our bearish view, meeting the 1.1520 target and printing 1.1510. Technical outlook Trend/SMAs: Price remains below the simple moving averages and under a descending trendline, keeping recovery attempts capped. RSI: Attempting to unwind oversold, but downtrend dominance persists. Base case (bearish while …
Read More »Dow Jones Deepens Its Losses 19/11/2025
The index logged sharp losses in the week’s first session, posting a 46,397 low. Technical outlook 50-SMA (4H): Rolling over above price and acting as a descending ceiling (dynamic resistance), reinforcing the daily downtrend. RSI: Remains negative despite oversold readings, underscoring strong near-term bearish momentum. Base case (bearish while below …
Read More »CAD Hits Resistance 19/11/2025
Selling pressure dominated the USD/CAD pair after it encountered resistance at 1.4060, forcing it into negative trading. Technical Outlook – 4-Hour Timeframe The simple moving averages have returned to exert downward pressure on the price and are acting as a dynamic resistance level. This is further supported by negative signals …
Read More »GBP Waits for a Near-Term Confirmation Signal 19/11/2025
GBP/USD — 4H Technical Update The setup is broadly unchanged: price action is muted and the downtrend remains the dominant theme. Technical outlook RSI: Still printing negative signals despite oversold readings—evidence of persistent bearish momentum. 50-SMA (4H): Price is holding above the average, providing some underlying support—hence the mixed picture. …
Read More »Oil Kicks Off on a Positive Note 19/11/2025
WTI caught a bid after basing near $59.30, with buyers regaining traction. Technical outlook 50-SMA (4H): Price has reclaimed and is stabilizing above it, adding positive momentum. RSI: Turning constructive, supporting the recovery attempt. Base case (bullish bias while above $60.10 / $59.80) Holding $60.10—and more broadly $59.80—keeps the topside …
Read More » Noor Trends News, Technical Analysis, Educational Tools and Recommendations

