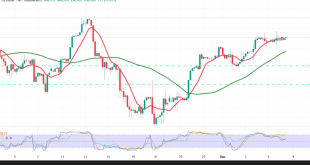
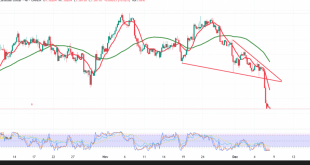
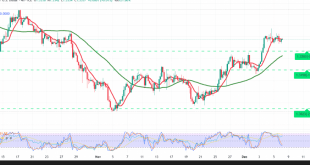
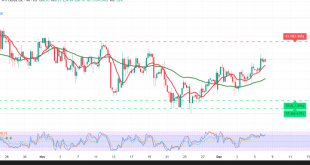
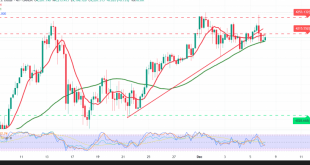
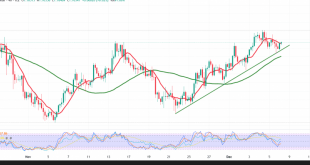
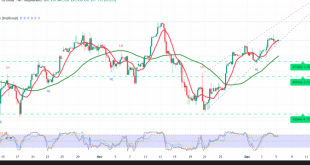
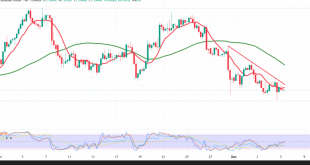
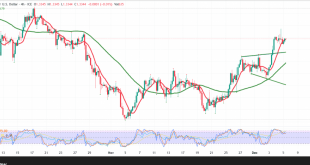
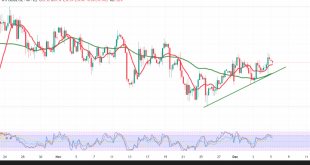
An upward trend continues to dominate the Dow Jones Industrial Average, reaching a high of 48,183. Technical Outlook – 4-Hour Timeframe: The 50-period Simple Moving Average (SMA) continues to support the broader daily uptrend and provides positive momentum for price movements. The Relative Strength Index (RSI) is also generating positive …
Read More »CAD: a sharp downward trend 8/12/2025
The USD/CAD pair is experiencing a sharp decline within a strong downward trend after breaking the key support level at 1.3900. Technical Outlook – 4-Hour Timeframe: The simple moving averages continue to apply downward pressure from above, with no dynamic resistance in place, while the pair moves along a steep …
Read More »GBP begins attacking the resistance 8/12/2025
An upward trend dominated the GBP/USD pair at the end of last week’s trading, reaching a high of 1.3363. Technical Outlook – 4-Hour Timeframe: Simple moving averages continue to provide positive momentum, supporting ongoing upward attempts. This is reinforced by positive divergence signals on the Relative Strength Index (RSI), along …
Read More »Oil may continue to advance 8/12/2025
US crude oil futures extended the upward trend highlighted in the previous technical report, reaching the first target at $60.00 and coming within a few points of the next target at $60.60, after recording a high of $60.45. Technical Outlook – 4-Hour Timeframe: Prices continue to move along a minor …
Read More »Gold is on tenterhook, a struggle between rise and fall! 8/12/2025
Gold (XAU/USD) continued to show mixed, indecisive movements, fluctuating between upward and downward attempts without establishing a clear short-term trend, as traders remained cautious and hesitant. Technical Outlook – 4-Hour Timeframe: Trading below the key resistance level at 4245 keeps the bearish scenario valid, supported by clear negative signals from …
Read More »Euro supported by an upward trend line 8/12/2025
The EUR/USD pair continues its gradual upward trend, reaching a high of 1.1680 in line with earlier expectations. Technical Outlook – 4-Hour Timeframe: The pair has formed strong support near 1.1630, with simple moving averages maintaining positive momentum and reinforcing the bullish bias. The Relative Strength Index (RSI) also continues …
Read More »Dow Jones extends its gains 5/12/2025
The Dow Jones Industrial Average (DJIA) extended its gains on Wall Street, reaching a high of 48,131. Technical Outlook – 4-Hour Timeframe: The 50-period Simple Moving Average (SMA) continues to support the prevailing upward trend and provides additional positive momentum. The Relative Strength Index (RSI) is also delivering positive signals, …
Read More »CAD Moves Along a Descending Trendline 5/12/2025
A gradual downward trend dominated USD/CAD movements, with the pair reaching a low of 1.3925. Technical Outlook – 4-Hour Timeframe: The simple moving averages continue to apply downward pressure, while the pair trades along a steep descending trend line—both reinforcing the bearish structure. Likely Scenario: As long as the price …
Read More »GBP is gaining ground against USD 5/12/2025
The British pound (GBP/USD) recorded a notable surge, posting strong gains yesterday near 1.3390. Technical Outlook – 4-Hour Timeframe: Simple moving averages continue to provide positive momentum, reinforcing the ongoing upward movement, supported further by positive divergence signals on the Relative Strength Index (RSI). As long as daily trading holds …
Read More »Oil receives positive signals 5/12/2025
An upward trend dominated WTI crude oil futures in the previous session, with the price beginning to test the psychological resistance at $60.00. Technical Outlook – 4-Hour Timeframe: Oil is moving along a minor ascending trend line while maintaining stability above the 50-period simple moving average, which continues to act …
Read More » Noor Trends News, Technical Analysis, Educational Tools and Recommendations

