
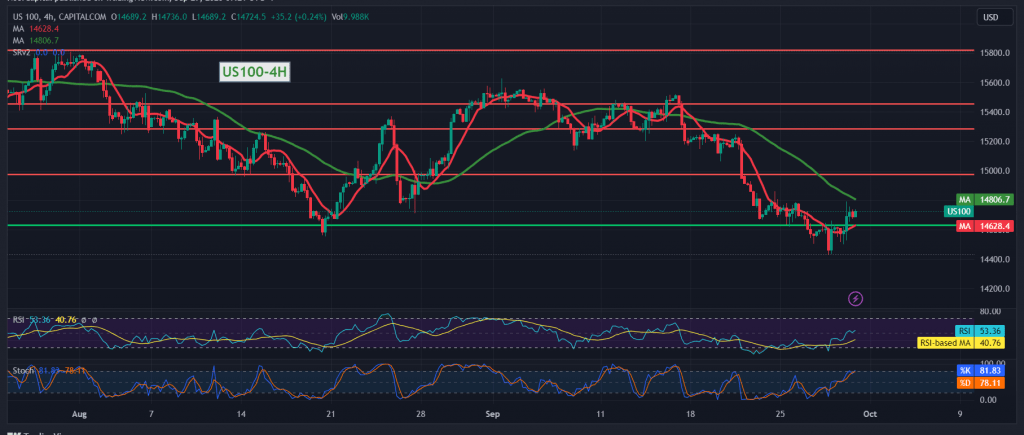
An upward trend dominated the movements of the Nasdaq index during the transactions of the previous trading session after it succeeded in penetrating the strong resistance level published in the last technical report at 14,680, explaining that the consolidation of the price above it will immediately stop the proposed bearish scenario and lead the index to retest 14,790, recording its highest level of 14,790.
On the technical side today, by looking at the 4-hour time frame chart, we find the 14-day momentum indicator providing positive signals and trading stability above the resistance mentioned above.
From here, with the stability of intraday trading at 14,630, there may be a possibility of an upward tendency, knowing that the upward leap and the price’s consolidation above 14,810 is a motivating factor that enhances the chances of a rise to visit 14,845 as a first target, and the gains may extend later towards 14,960 initially.
Trading stability and price consolidation below 14,630 will immediately stop the proposed bullish scenario and lead the index to retest 14,550.
Note: Today we are awaiting high-impact economic data issued by the American economy, the Core Personal Consumption Expenditure Index, and we may witness high fluctuation in prices at the time of the news release.
Note: Trading on CFDs involves risks. Therefore, all scenarios may be possible. This article is not a recommendation to buy or sell but rather an explanatory reading of the price movement on the chart.
| S1: |