
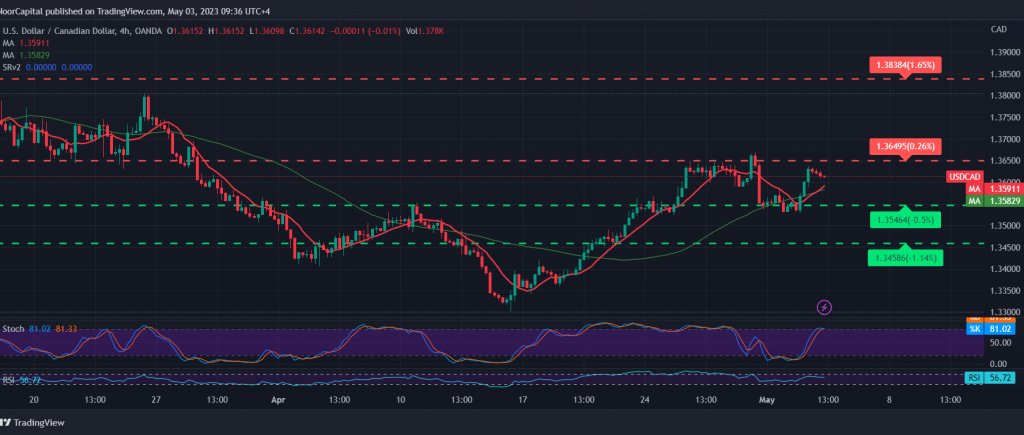
It is hovering around its highest level during the current session at 1.3615.
Technically, and with a closer look at the chart, the simple moving averages continue to support the daily bullish price curve. On the other hand, signs of negativity began to appear on the stochastic indicator, which started to lose bullish momentum due to entering overbought areas gradually.
The trend tends to be bullish, but we may witness some bearish inclination aimed at retesting 1.3550 and 1.3510 before resuming the bullish path again, and we must be aware that the bearish bias does not contradict the bullish trend, whose initial targets are located around 1.3660.
Note: Today, we are awaiting high-impact economic data issued by the US economy, “change in private sector jobs, services PMI, interest rate, Federal Reserve Committee statement and Federal Reserve press conference”, and we may witness high volatility at the time of news release.
Note: Trading on CFDs involves risks. Therefore, all scenarios may be possible. This article is not a recommendation to buy or sell but rather an explanatory reading of the price movement on the chart.
| S1: |