GBP/USD Technical Analysis
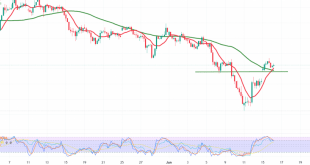
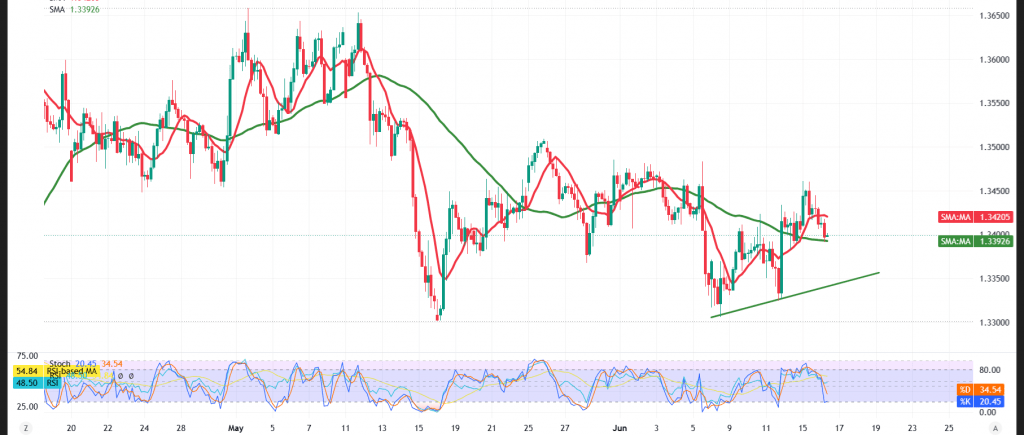
A limited bearish bias dominated the price action of the GBP/USD pair during the previous session, with the pair sliding to an intraday low of 1.3390 before beginning to show signs of consolidation near the key support floors.
Technical Outlook – 4-Hour Timeframe:
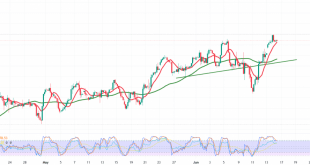
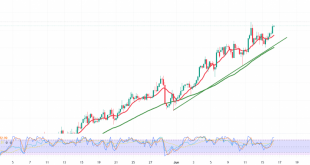
With respect to intraday dynamics, the simple moving averages continue to fulfill their role as effective dynamic support zones, persisting in their effort to underpin the price from below and contain further downside — a configuration that strengthens the prospects of a return to the upward bias across the upcoming period.
On the flip side, the Relative Strength Index (RSI) is broadcasting positive signals across the shorter timeframes after pushing decisively into oversold territory relative to the price action — a reading that points to the potential formation of a fresh momentum base capable of supporting the ongoing recovery attempts.
Sustained trading above the key support floors preserves the constructive outlook, particularly given the continued failure of sellers to assert complete control over the pair’s price action.
Expected Scenarios:
Bullish (Most Likely) Scenario:
Sustained trading above the 1.3360 support floor preserves the advantage of the uptrend, with the initial target set at:
- 1.3440
A decisive breach of this level would unlock the path toward further gains targeting:
- 1.3480 as the subsequent objective
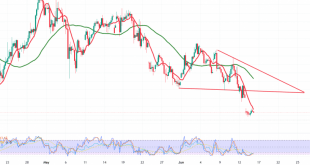
Bearish Scenario:
Conversely, a decisive breakdown beneath the 1.3360 level would bring the downtrend back to the forefront, with targets emerging at:
- 1.3340 as the initial objective
- Followed by 1.3310 as the subsequent level
Risk Alert: Risk levels remain elevated amid persistent trade frictions and geopolitical tensions — all scenarios should be considered plausible.
Trading CFDs involves risks, and therefore all scenarios may be plausible. The information provided above is not a recommendation to sell or buy but rather an explanatory reading of price movement on the chart.
| S1: 1.3375 | R1: 1.3445 |
| S2: 1.3340 | R2: 1.3490 |
| S3: 1.3305 | R3: 1.3515 |