EUR/USD Technical Analysis
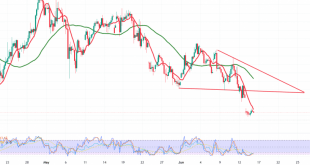
The EUR/USD pair exhibited a modest downward bias across recent trading sessions after encountering pivotal resistance in the vicinity of 1.1630 — a development that prompted a temporary corrective move within the broader uptrend.
Technical Outlook – 4-Hour Timeframe:
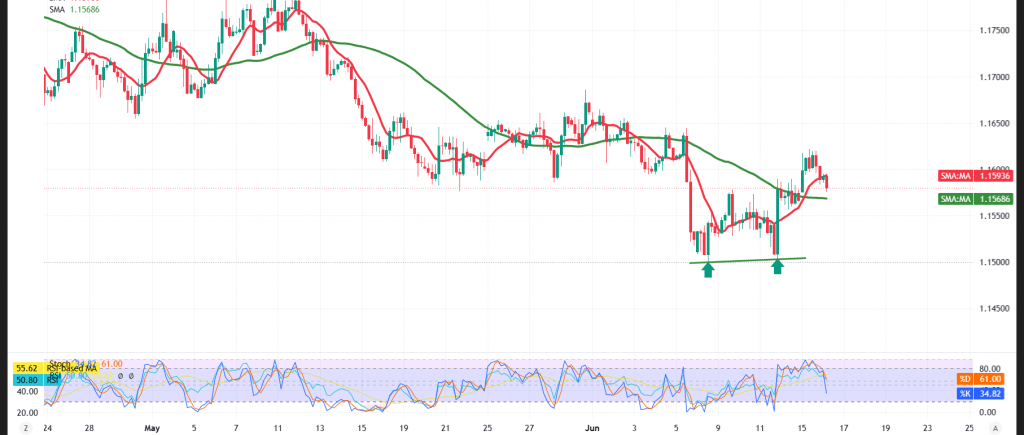
On the short-term horizon, the Relative Strength Index (RSI) has flashed negative signals after previously pushing into overbought territory — a configuration that suggests the current pullback represents a natural process of unwinding overbought conditions and rebuilding the momentum required to resume the uptrend.
On the constructive side, the pair remains anchored above the 50-period simple moving average, which continues to provide underlying support. Adding to the positive picture, a bullish double-bottom pattern is taking shape on the chart — a technical formation that lends weight to the probability of a resumption of the uptrend over the near term.
Taken as a whole, the technical outlook remains constructive as long as trading holds above the key support floors.
Expected Scenarios:
Bullish (Most Likely) Scenario:
As long as trading remains anchored above the 1.1550 support floor, the prospects of a resumption of the uptrend will remain firmly on the table — particularly should the price confirm a decisive break above 1.1630 and sustain trading above it — with targets set at:
- 1.1655 as the initial objective
- Followed by 1.1700 as the subsequent target
Bearish Scenario:
Conversely, a confirmed hourly candle close beneath 1.1540 would expose the pair to renewed negative pressure, with:
- 1.1500 emerging as the initial downside target
- Followed by 1.1470 as the subsequent level
- Risk Disclaimer: Trading CFDs involves risks, and therefore the scenarios outlined above are not a recommendation to sell or buy but rather an explanatory reading of price movement on the chart.
| S1: 1.1510 | R1: 1.1600 |
| S2: 1.1470 | R2: 1.1630 |
| S3: 1.1420 | R3: 1.1665 |