
US Crude Oil (WTI) Technical Analysis
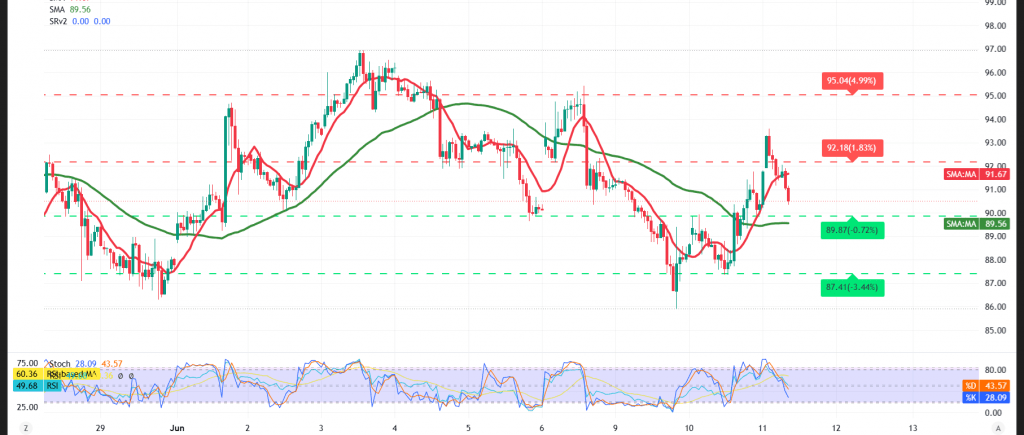
US crude oil prices mounted recovery attempts after anchoring on the pivotal support zone near $87.40, amid mixed price action that reflects a state of anticipation as market participants await a clear directional catalyst.
Technical Outlook – 4-Hour Timeframe:
With respect to intraday dynamics, prices have successfully pierced the simple moving averages and established trading above them — a constructive signal that could underpin continued recovery attempts over the short term and supply buyers with some additional momentum.
On the flip side, the Relative Strength Index (RSI) continues to broadcast negative signals as a result of its positioning near overbought territory — a reading that could temper the pace of the advance and raise the probability of exposure to some temporary selling pressure.
Compounding this picture, the continuation of trading beneath a descending trendline represents an important technical hurdle standing in the way of a fully fledged recovery, keeping the prospects of a return to negative pressure firmly on the table unless prices succeed in breaching the key resistance levels.
Expected Scenarios:
Bearish (Most Likely) Scenario:
Should intraday trading remain capped beneath the $91.30 resistance, the bearish bias is likely to retain the upper hand, with the initial target set at:
- $88.80
Bullish Scenario:
Conversely, a sustained recovery and stabilization above the $91.90 level would compel prices to resume the upside trajectory at a more accelerated pace, with:
- $93.50 emerging as the initial upside target
Disclaimer: Trading oil carries substantial risk and may not be suitable for all investors.
Risk Alert: Risk levels remain elevated amid persistent trade frictions and geopolitical tensions — all scenarios should be considered plausible.
Trading in CFDs involves high risk, and therefore all scenarios are subject to potential outcomes. The analysis provided above is not a recommendation to buy or sell but rather an illustrative reading of price action on the chart.
| S1: 87.45 | R1: 93.60 |
| S2: 84.35 | R2: 96.70 |
| S3: 81.25 | R3: 99.80 |


