
Dow Jones Industrial Average (DJIA) Technical Analysis
The Dow Jones Industrial Average traded on a negative footing during the previous US session, after reaching an intraday high of 51,329.
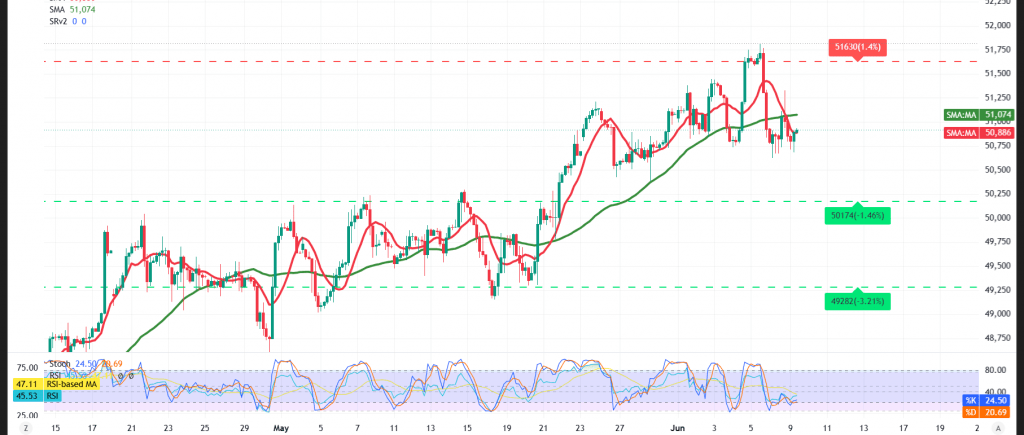
Technical Outlook for Today’s Session – 4-Hour Timeframe:
Within the intraday landscape, the index ran into formidable resistance in the vicinity of 51,275 — a level that triggered a fresh wave of downside price action.
The Relative Strength Index (RSI) is likewise broadcasting clear negative signals, with the indicator currently holding beneath the 50 midline — a reading that mirrors the deterioration in underlying momentum.
Bearish (Most Likely) Scenario:
As long as trading remains capped below the 51,275 resistance ceiling, the prospects of a downward trajectory will retain the upper hand, with targets set at:
- 50,620 as the initial objective
- Followed by 50,320 as the subsequent level
Bullish Scenario:
Conversely, a sustained recovery and stabilization above 51,275 could propel the index toward fresh gains, with 51,630 emerging as the initial upside target.
Risk Alert: Risk levels remain elevated amid persistent trade frictions and geopolitical tensions — all scenarios should be considered plausible.
Trading in CFDs involves risks, and therefore all scenarios are subject to potential outcomes. The analysis provided above is not a recommendation to buy or sell but rather an illustrative reading of price action on the chart.
| S1: 50620 | R1: 51275 |
| S2: 50320 | R2: 51630 |
| S3: 49965 | R3: 51930 |


