US Crude Oil (WTI) Technical Analysis
US crude oil futures retreated during the previous session as part of a natural corrective move accompanied by profit-taking activity, following the strong gains the contract has harvested over the recent period.
Technical Outlook – 4-Hour Timeframe:
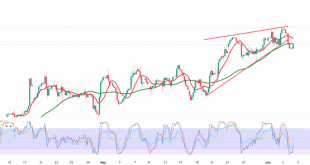
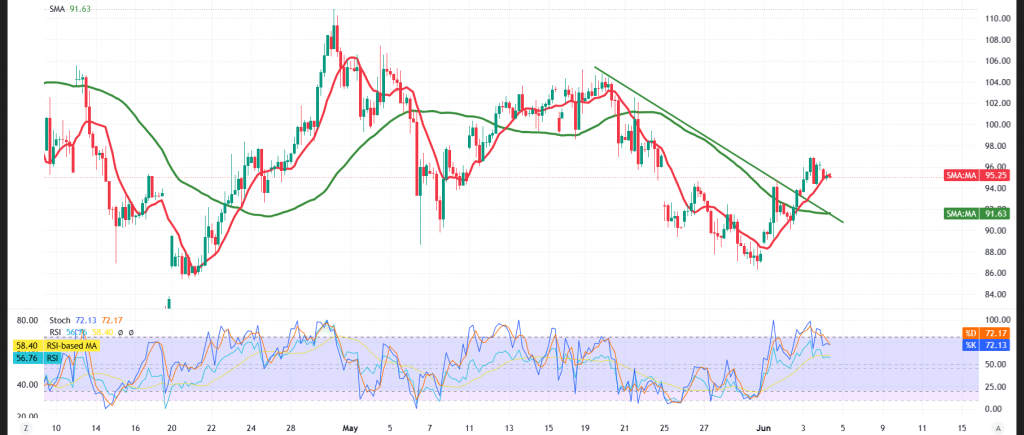
Oil prices have successfully unwound the prior overbought condition — as is clearly evident on the Relative Strength Index (RSI) — which may equip the contract to regain bullish momentum in due course.
At the same time, prices remain anchored above the simple moving averages, which continue to underpin the uptrend across both the short and medium-term horizons. This dynamic coincides with the price’s earlier successful breakout above a descending corrective trendline, which has now flipped into a constructive technical support floor reinforcing the prevailing gains.
Taken together, these technical readings suggest that the recent declines fall within the framework of a temporary corrective move within the broader uptrend, unless the pivotal support levels are decisively breached.
Expected Scenarios:
Bullish (Most Likely) Scenario:
Should intraday trading establish a foothold above the $94.20 support, the bullish bias is likely to retain the upper hand, with the initial target set at:
- $96.25
Upon a decisive breach of this level, gains could extend toward:
- $96.80 as the subsequent objective
Bearish Scenario:
Conversely, a return and stabilization beneath the $93.55 level would compel prices to resume the downside trajectory at a more accelerated pace, with:
- $92.00 emerging as the initial downside target
Disclaimer: Trading oil carries substantial risk and may not be suitable for all investors.
Risk Alert: Risk levels remain elevated amid persistent trade frictions and geopolitical tensions — all scenarios should be considered plausible.
Trading in CFDs involves high risk, and therefore all scenarios are subject to potential outcomes. The analysis provided above is not a recommendation to buy or sell but rather an illustrative reading of price action on the chart.
| S1: 93.55 | R1: 96.80 |
| S2: 92.00 | R2: 98.50 |
| S3: 90.30 | R3: 100.05 |