
Gold (XAU/USD) Technical Analysis
Gold prices extended their decline under sustained selling pressure, in line with the bearish outlook outlined in our previous report. The precious metal successfully reached its formal initial target of $4,430, printing an intraday low of $4,423 per ounce.
Technical Outlook – 4-Hour Timeframe:
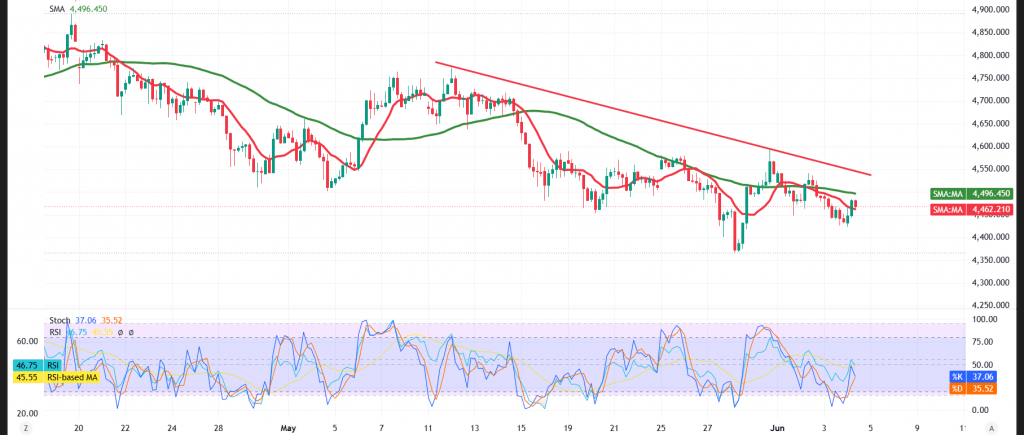
Current price action is exhibiting a limited technical rebound, drawing support from a relative improvement in momentum indicators. The Relative Strength Index (RSI) has pushed decisively into oversold territory — a condition that may provide some temporary underpinning over the coming hours.
That said, the broader technical picture remains firmly bearish, as gold continues to trade beneath the simple moving averages, which are exerting downward pressure on the price. This dynamic is reinforced by the price navigating within a descending channel and tracking along a descending trendline — a combination that lends further weight to the short-term bearish scenario.
Compounding this picture, the current recovery attempts still lack sufficient momentum to validate a genuine trend reversal. Any recent rallies appear to be more reflective of a corrective move within the broader downtrend, unless the key resistance levels are decisively breached.
Bearish (Most Likely) Scenario:
Sustained trading beneath the pivotal $4,500 resistance ceiling preserves the bearish bias, with the initial target set at:
- $4,427
A decisive break below this level — coupled with sustained trading beneath it — would amplify selling pressure and pave the way toward:
- $4,388 as the subsequent objective
Bullish Scenario:
This scenario would only be validated should gold deliver a decisive and convincing break above the $4,500 level and sustain trading above it — a development that would supply the price with the impetus to reclaim bullish momentum and target:
- $4,535 as the initial upside objective
Disclaimer: Trading gold carries substantial risk and may not be suitable for all investors.
Risk Alert: Risk levels remain elevated amid persistent trade frictions and geopolitical tensions — all scenarios should be considered plausible.
Risk Disclaimer: Trading CFDs involves risks, and therefore all scenarios may be plausible. The content above is not a recommendation to sell or buy but rather an explanatory reading of price movement on the chart.
| S1: 4427.00 | R1: 4500.00 |
| S2: 4388.00 | R2: 4535.00 |
| S3: 4355.00 | R3: 4573.00 |


