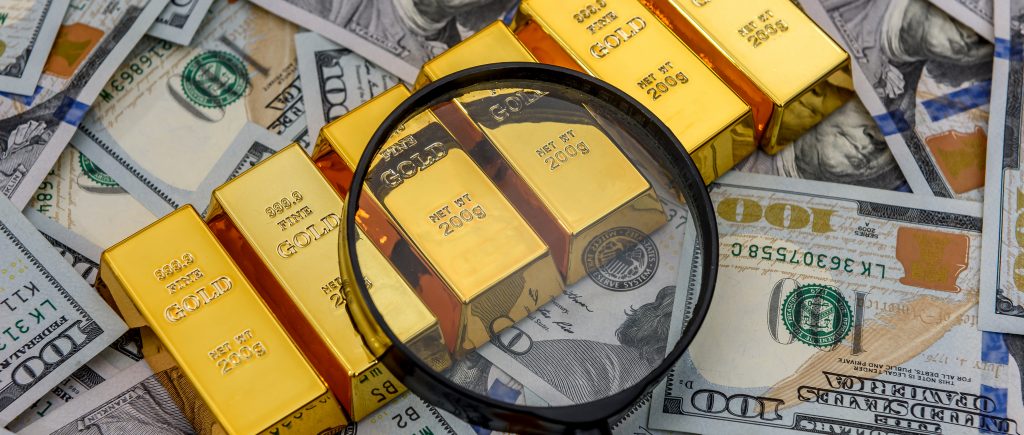
Thanks to recent slew of data on economic growth and a decline in US Treasury yields, the price of gold is stable around $2034 per ounce. Concerns about policy easing from the Fed and mixed US economic data keep gold investors on edge. Gold’s advances are limited by the 50-day SMA as Wall Street indices indicate a cautious attitude among investors.
Gold price remains steady near $2,030 on Wednesday, posting a gain of 0.17% after the US Bureau of Economic Analysis (BEA) revealed the country’s economy expanded. A drop in US Treasury bond yields has kept the precious metal near the current month and weekly highs, capped by the 50-day Simple Moving Average (SMA).
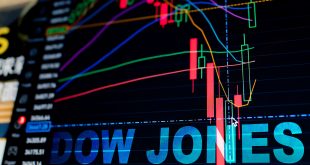
Wall Street treads water with most indices trading in the red. The Gross Domestic Product (GDP) for the last quarter in 2023 expanded a tick lower than the consensus and the preliminary reading, while Retail and Wholesale Inventories came in mixed.
Remarks by Fed officials
New York Fed President John Williams stated, “While the economy has come a long way toward achieving better balance and reaching our 2% inflation goal, we are not there yet.” Williams added that he would need to assess “the data, the economic outlook and the risks, in evaluating the appropriate path for monetary policy that best achieves our goals.”
Fed Regional Presidents Susan Collins and John Williams crossed the newswires. They repeated previous remarks regarding easing policy later in the year and emphasized they haven’t reached the 2% goal for core inflation.
Boston Fed President Susan Collins said, “I believe it will likely become appropriate to begin easing policy later this year.” She added, “When this happens, a methodical, forward-looking approach to reducing rates gradually should provide the necessary flexibility to manage risks while promoting stable prices and maximum employment.”
On Tuesday, Fed’s Michelle Bowman said she’s in no rush to cut rates, given upside risks to inflation that could stall progress or cause a resurgence in price pressure. Bowman said that inflation would decline “slowly,” adding that she will remain “cautious in my approach to considering future changes in the stance of policy.”
The Gross Domestic Product (GDP) for the final quarter of 2023 was reported at 3.2% YoY, slightly below the preliminary estimate of 3.3%. US Retail Sales Inventories rose 0.3% MoM in January, below 0.4% in the previous month’s data, while Wholesale Inventories declined -0.1% MoM, missing estimates of 0.1%.
Previous data releases:
US Durable Goods Orders dropped -6.1% MoM, more than the -4.5% contraction expected and the -0.3% dip observed in December.
The S&P/Case Shiller Home Price Index for December rose 6.1% YoY, outpacing estimates of 6% and November’s 5.4% reading.
US New Home Sales rose by 1.5% from 0.651M to 0.661M, less than the 0.68M expected.
The Dallas Fed Manufacturing Index for February contracted -11.3, though it improved compared to January’s -27.4 shrinkage, suggesting that business activity is recovering.
The US Dollar Index (DXY), which gauges the American currency’s value against six major currencies, edges up at 103.95 as uncertainty over US economic data has improved the appeal for safe-haven assets.
The US 10-year Treasury note yield stands at 4.284%, down two basis points (bps). Interest rate speculators have priced out a Fed rate cut in March and May. For June, the odds of a 25-basis point rate cut are at 49.7%. Investors are pricing in 85 basis points of easing throughout 2024.
Gold is trading sideways as XAU/USD has failed to break above the $2,035 psychological resistance level for the last 12 days. Nevertheless, the upward bias remains intact, and if buyers reclaim the $2,035 level, that could open the door to challenge the psychological $2,050 figure. Key resistance levels up next would be the February 1 high at $2,065.60, ahead of the December 28 high at $2,088.48.
On the flipside, if Gold falls below the February 16 swing low of $2,016.15, XAU/USD would dive toward the October 27 daily high-turned-support at $2,009.42. Once cleared, that will expose key technical support levels like the 100-day SMA at $2,009.42, followed by the 200-day SMA at $1,967.45.