
GBP/USD Technical Analysis
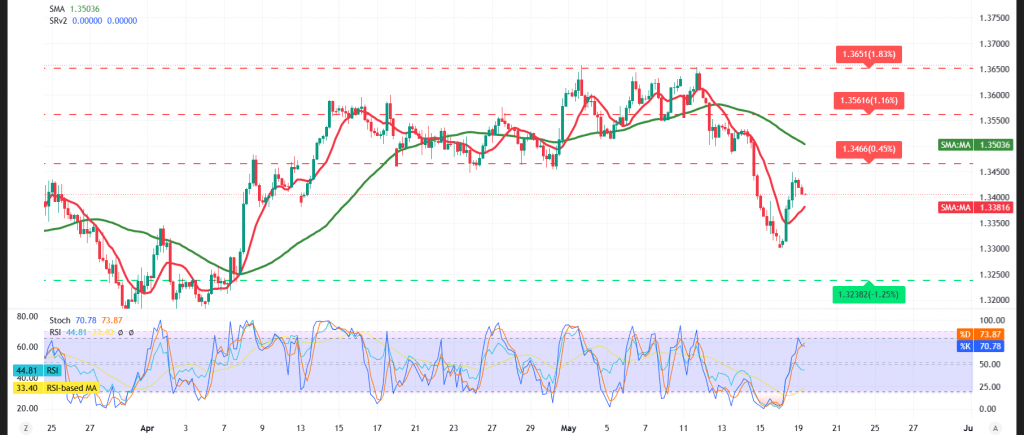
The GBP/USD pair temporarily reversed its anticipated bearish trajectory after the price consolidated above the 1.3380 resistance level. We had highlighted that a decisive break above 1.3380 could reignite temporary upside momentum targeting 1.3445 — a projection that was duly fulfilled, with the pair printing an intraday high of 1.3449.
Technical Outlook – 4-Hour Timeframe:
On the short-term horizon, the simple moving averages continue to function as dynamic resistance barriers, imposing downward pressure on the price. This dynamic coincides with the ongoing bearish corrective wave, which caps the prospects of a sustained recovery over the current period.
Compounding the negative picture, the Relative Strength Index (RSI) is broadcasting clear negative signals alongside a bearish divergence — a combination that lends further support to the pair’s vulnerability to renewed selling pressure.
Expected Scenarios:
Bearish (Most Likely) Scenario:
As long as trading remains capped below the 1.3470 resistance ceiling, the downward bias will retain the upper hand, with 1.3325 set as the initial target. A decisive break beneath this level would unlock the path toward further declines targeting 1.3240 as the subsequent objective.
Bullish Scenario:
Conversely, a decisive breakout above the 1.3470 resistance would reignite temporary upside momentum, with 1.3535 emerging as the initial target.
Risk Alert: Risk levels remain elevated amid persistent trade frictions and geopolitical tensions — all scenarios should be considered plausible.
Trading CFDs involves risks, and therefore all scenarios may be plausible. The information provided above is not a recommendation to sell or buy but rather an explanatory reading of price movement on the chart.
| S1: 1.3325 | R1: 1.3470 |
| S2: 1.3235 | R2: 1.3535 |
| S3: 1.3175 | R3: 1.3620 |


