
US Crude Oil (WTI) Technical Analysis
US crude oil futures have surrendered a significant portion of their recent gains, retreating beneath the psychological $100-per-barrel barrier — a development that signals a deterioration in bullish momentum and the dominance of short-term selling pressure across the contract.
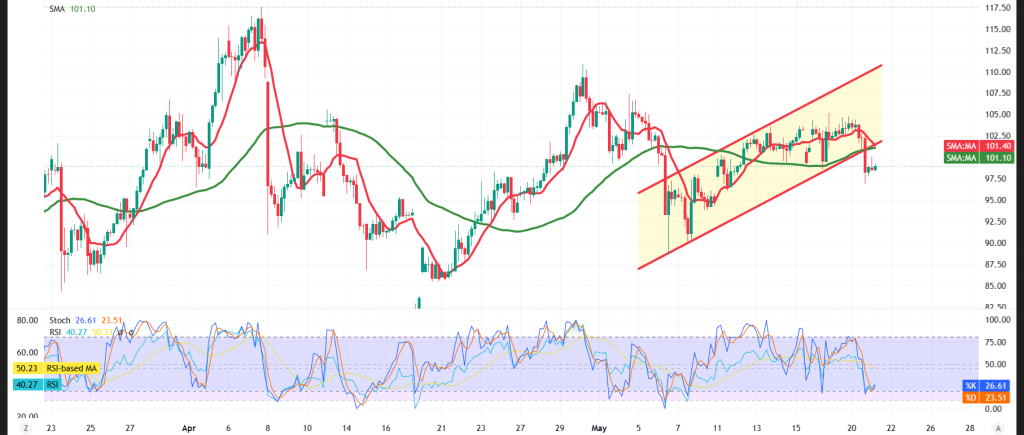
Technical Outlook – 4-Hour Timeframe:
On the short-term horizon, the price has broken out of the ascending price channel illustrated on the chart — a negative technical signal that points to a clear shift toward a bearish trajectory.
The simple moving averages have likewise resumed exerting downward pressure on the price, coinciding with the failure of recent recovery attempts. This dynamic diminishes the prospects of a constructive rebound over the current period.
On the flip side, the Relative Strength Index (RSI) continues to broadcast clear negative signals despite having dipped into oversold territory — a reading that mirrors the persistent weakness in buying momentum and the entrenched dominance of sellers in the market.
Bearish (Most Likely) Scenario:
As long as trading remains capped below the $100 resistance ceiling — and more broadly beneath $101.40 — the bearish bias will retain the upper hand, with $95.85 set as the initial downside target.
Bullish Scenario:
Conversely, a sustained recovery and stabilization above the $101.40 level would propel the price higher once again, with $103.30 emerging as the initial upside target.
Disclaimer: Trading oil carries substantial risk and may not be suitable for all investors.
Trading in CFDs involves high risk, and therefore all scenarios are subject to potential outcomes. The analysis provided above is not a recommendation to buy or sell but rather an illustrative reading of price action on the chart.
| S1: 95.85 | R1: 103.30 |
| S2: 92.75 | R2: 107.55 |
| S3: 88.45 | R3: 110.70 |


