
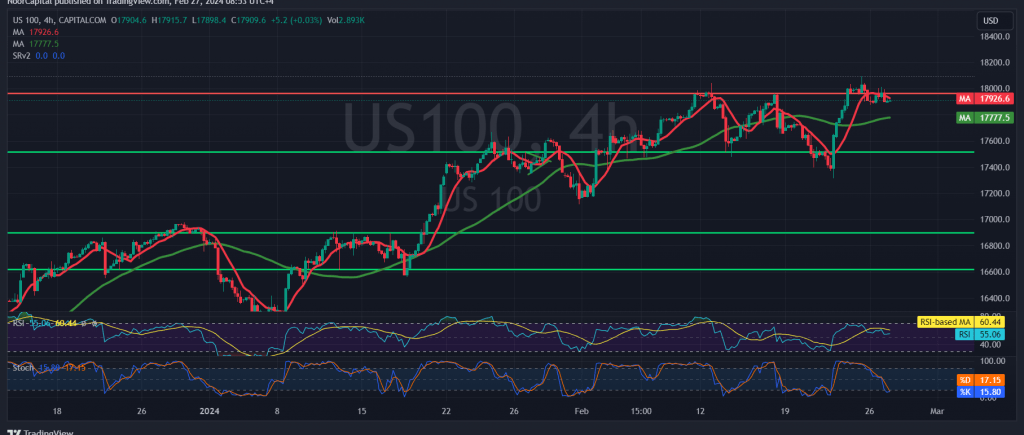
A marginal downward trend characterized the movements of the Nasdaq index yesterday, reaching its nadir during the initial trading sessions at 17,875.
From a technical perspective today, upon closer examination of the 240-minute timeframe chart, the index exhibits stability above the 50-day simple moving average, with the Stochastic indicator indicating a gradual departure from the prevailing negative signals.
Consequently, the potential for an uptick remains viable and potent, contingent upon daily trading persisting above 17,850. The primary target stands at 17,990, with a breakthrough enhancing the index’s gains and paving the way for a direct ascent towards 18,070 and 18,130.
However, should the index dip below 17,850 and close an hour candle beneath this threshold, it would nullify the upward momentum and subject the index to temporary negative pressure, with a target set at 17,790.
A note of caution: Transaction quality may not be optimal.
Furthermore, today’s trading landscape is punctuated by the impending release of influential economic data from the American economy, particularly the “Consumer Confidence Index,” which may engender heightened price fluctuations upon its dissemination.
Moreover, it is essential to acknowledge the heightened risk environment amidst ongoing geopolitical tensions, which could contribute to increased price volatility.
Note: Trading on CFDs involves risks. Therefore, all scenarios may be possible. This article is not a recommendation to buy or sell but rather an explanatory reading of the price movement on the chart.
| S1: |