
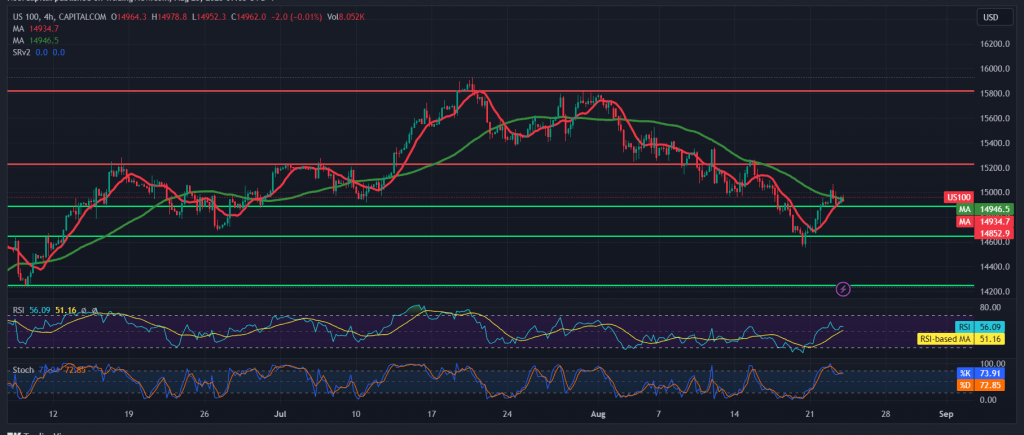
Yesterday, the Nasdaq index traded with remarkable positivity during the middle of American trading, touching the first official target to be achieved at 15,030, recording its highest level at 15,065.
Technically, the level of 15,065 formed a strong resistance level that forced the index to give up its gains, to return and settle again below 15,060, and we notice the beginning of the appearance of negative signs on the stochastic indicator, accompanied by negative signs on the relative strength index.
We may witness a bearish trend, but with caution, on the condition that we confirm the breach of 14,900, targeting 14,875, the first target of knowing that breaking the mentioned level may enhance the chances of a decline to visit 14,785.
As a reminder, the return of trading stability above 15,060 can thwart the bearish scenario and lead the index to continue rising towards 15,155.
Note: Today, we are waiting for high-impact economic data issued by the US economy and England, such as “Services and Manufacturing PMI”, and from Canada, later in today’s session, we are waiting for “Retail Sales” in addition to the summit of the “BRICS” group We may witness high price volatility.
Note: Trading on CFDs involves risks. Therefore, all scenarios may be possible. This article is not a recommendation to buy or sell but rather an explanatory reading of the price movement on the chart.
| S1: |