
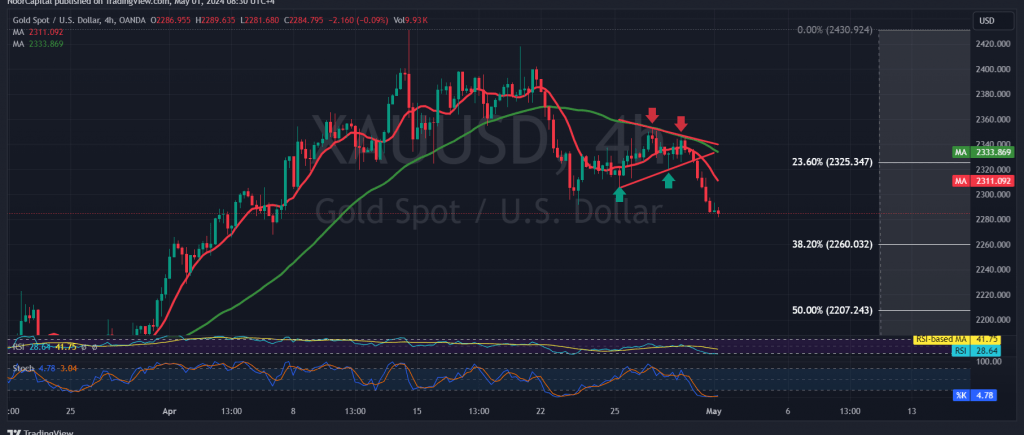
Gold prices experienced significant losses during yesterday’s trading session, in line with our previous technical analysis, reaching the official targets set at $2290 per ounce. The lowest point was recorded at $2281 per ounce during early trading.
Today’s technical outlook suggests a potential continuation of the downward correction, with trading remaining below the psychological support level of $2300. Additionally, the moving averages have formed a negative intersection, indicating further downside momentum. This bearish sentiment is reinforced by negative signals from the 14-day momentum indicator.
As such, the most probable scenario is a continuation of the downward correction towards the remaining targets outlined in the previous report, notably the Fibonacci correction level of 38.20% at $2260. This level holds significance for the short-term trend, and a break below it could accelerate the downward momentum, potentially opening the path towards $2245.
However, if gold manages to surpass and stabilize trading above $2300, especially $2317, for at least an hour candle, it could mitigate losses and pave the way for a retest of the first target at $2354. Further gains could extend towards $2360.
It’s important to note that today, high-impact economic data is expected from the American economy, including the ADP, the Federal Reserve Committee statement, interest rate decision, and a press conference by the Chairman of the Federal Reserve. These events may lead to heightened price volatility.
Additionally, given the ongoing geopolitical tensions, the level of risk remains high, and significant price fluctuations are possible. Investors should exercise caution and closely monitor market developments.
Note: Trading on CFDs involves risks. Therefore, all scenarios may be possible. This article is not a recommendation to buy or sell but rather an explanatory reading of the price movement on the chart
| S1: |