
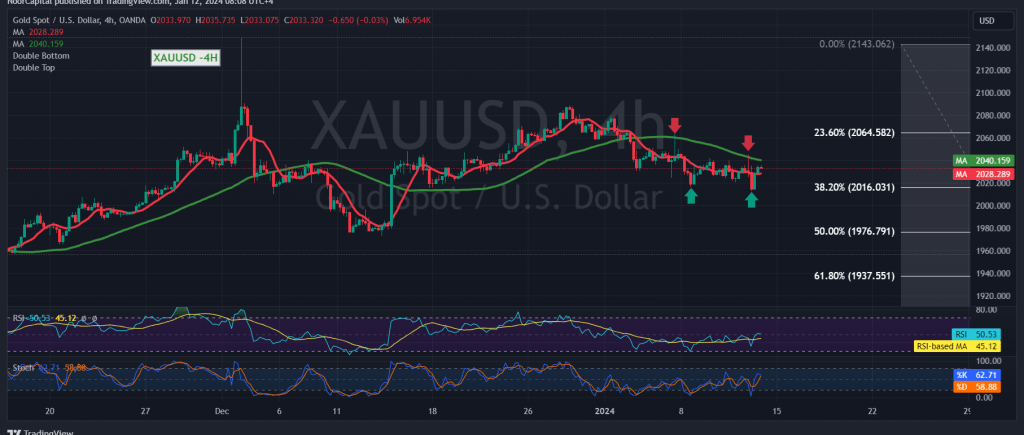
Gold experienced a downward trend in the previous trading session, testing the main support around 2016, before concluding the day’s trading above this support and embarking on an upward rebound, targeting a retest of 2035.
Analyzing the 240-minute chart, conflicting technical signals emerge. The 50-day simple moving average poses a hurdle around the 2047 resistance level, gaining additional strength from this level. On the other hand, the Stochastic indicator attempts to generate positive signals, supported by the positivity of the 14-day momentum indicator. Furthermore, trading stability above the 2016 Fibonacci retracement level of 38.20% adds another layer of complexity to the analysis.
Given these conflicting signals and the current trade confined between 2016 and 2047, it’s prudent to monitor the price behavior and be prepared for potential scenarios:
- Downward Trend: Breaking below 2016, a crucial support level, could accelerate the strength of the downward trend, with an initial target at 2000, followed by further targets extending to 1985.
- Upward Trend: Breaking above 2047 opens the path for a direct move toward 2065. A successful cross above and consolidation beyond 2065 could pave the way for gold prices to reach 2080.
Warnings:
- High-impact economic data is expected from the American economy today, including the “monthly core producer prices” and the “monthly producer price index.” Additionally, the “monthly gross domestic product” indicator from the United Kingdom is anticipated, potentially leading to increased volatility during the news release.
- The risk level is deemed high, particularly amid ongoing geopolitical tensions, contributing to the potential for increased price volatility. Caution is advised in light of these factors.
Note: Trading on CFDs involves risks. Therefore, all scenarios may be possible. This article is not a recommendation to buy or sell but rather an explanatory reading of the price movement on the chart.
| S1: |