
Dow Jones Industrial Average (DJIA) Technical Analysis
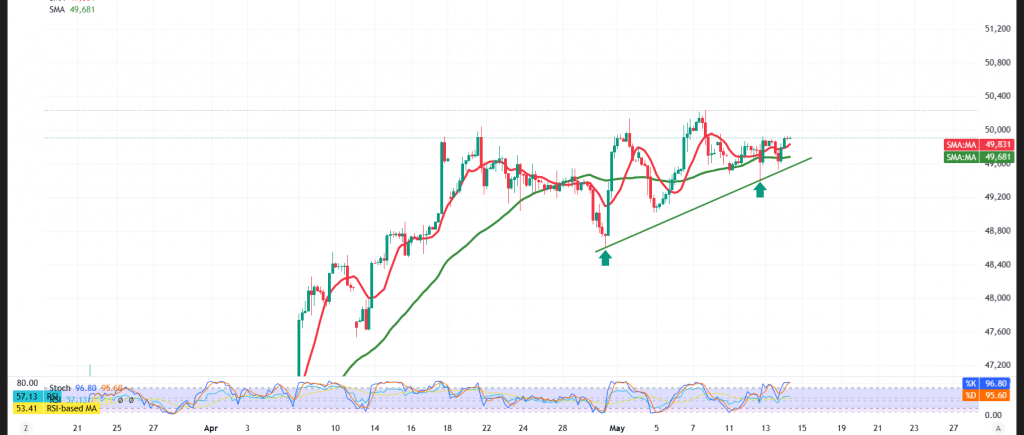
The Dow Jones Industrial Average extended its gains on Wall Street in line with the bullish trajectory projected in our previous technical report, climbing to an intraday high of 49,931.
Technical Outlook for Today’s Session – 4-Hour Timeframe:
With respect to intraday dynamics, the bias leans constructively, as trading remains anchored above the simple moving averages — which have successfully forged a bullish crossover that lends support to the continuation of the prevailing uptrend.
The Relative Strength Index (RSI) is likewise broadcasting clear positive signals. Although it has pushed into overbought territory, the reading still mirrors the strength of the current momentum and signals room for additional upside.
Bullish (Most Likely) Scenario:
Sustained trading above 49,770 — and more broadly above 49,650 — supports the continuation of the uptrend, provided a confirmed break above 49,930 materializes, with the initial target set at:
- 50,045
A decisive break above this level would propel the index toward further gains, targeting:
- 50,180 as the subsequent objective
Bearish Scenario:
Conversely, a return and stabilization beneath the 49,650 support floor could temporarily reignite selling pressure, exposing the index to a retest of:
- 49,395 as the initial downside level
Key Economic Events to Watch:
Today’s session features high-impact economic releases that have the potential to amplify volatility across the financial markets:
🇬🇧 United Kingdom:
- Monthly GDP
🇺🇸 United States:
- Retail Sales
Please note that elevated volatility and pronounced price swings are likely to materialize around the release of these data points.
Risk Alert: Risk levels remain elevated amid persistent trade frictions and geopolitical tensions — all scenarios should be considered plausible.
Trading in CFDs involves risks, and therefore all scenarios are subject to potential outcomes. The analysis provided above is not a recommendation to buy or sell but rather an illustrative reading of price action on the chart.
| S1: 49650 | R1: 50045 |
| S2: 49395 | R2: 50185 |
| S3: 49260 | R3: 50440 |


