
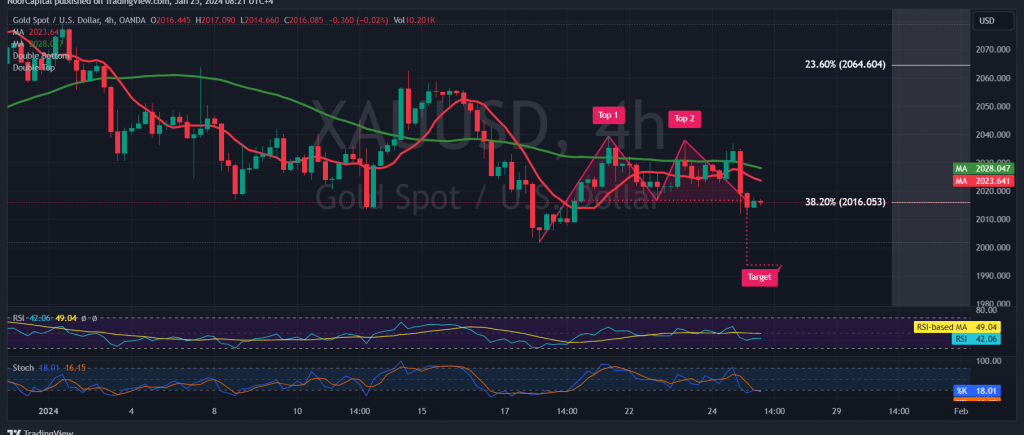
The resistance point highlighted in the previous technical report at the price of 2034 successfully impeded the upward trend temporarily. As mentioned yesterday, a prudent approach is to closely observe price behavior. A drop below 2016 could signify a shift towards a downward trend, with an initial target of 2009 and a potential low of $2011 per ounce.
In today’s technical outlook, scrutinizing the 240-minute timeframe chart reveals the current price hovering around the crucial 2016 level, a 38.20% Fibonacci retracement. Additionally, the return of simple moving averages exerting pressure from above, coupled with signs of declining momentum, leans towards a negative outlook.
While a bearish inclination exists, caution is advised. Intraday trading persisting below the 2030 resistance level and, more broadly, below 2037 targets 2005 as the next objective. A breach of this level intensifies the downward momentum, opening the path towards 1995 and 1980, anticipated levels.
For an upward trend to materialize, an immediate consolidation above 2016 is essential. Additionally, a clear and robust breach of the 2037 resistance level may enhance the likelihood of a temporary ascent towards 2044 and 2050, with potential gains extending to 2065 later.
Cautionary notes are warranted today, given the anticipation of high-impact economic data from the Eurozone, including the European Central Bank Monetary Policy Committee statement, interest rate announcements, and the press conference by the President of the European Central Bank. Consequently, heightened price fluctuations may be witnessed during the news release period.
Furthermore, it is crucial to note that the risk level is high, exacerbated by ongoing geopolitical tensions. Consequently, increased price volatility remains a possibility. Investors are advised to exercise caution in the current market environment.
Note: Trading on CFDs involves risks. Therefore, all scenarios may be possible. This article is not a recommendation to buy or sell but rather an explanatory reading of the price movement on the chart
| S1: |