
Gold Prices Display Limited Upside Amidst Technical Pressures
Gold prices exhibited modest upward movements during the preceding trading session, albeit with constrained momentum. In our previous analysis, we maintained a stance of intraday neutrality, awaiting either a breakout above the 2016 resistance or confirmation of a breakout below the 2035 support.
Technical Analysis: Complex Dynamics and Key Levels
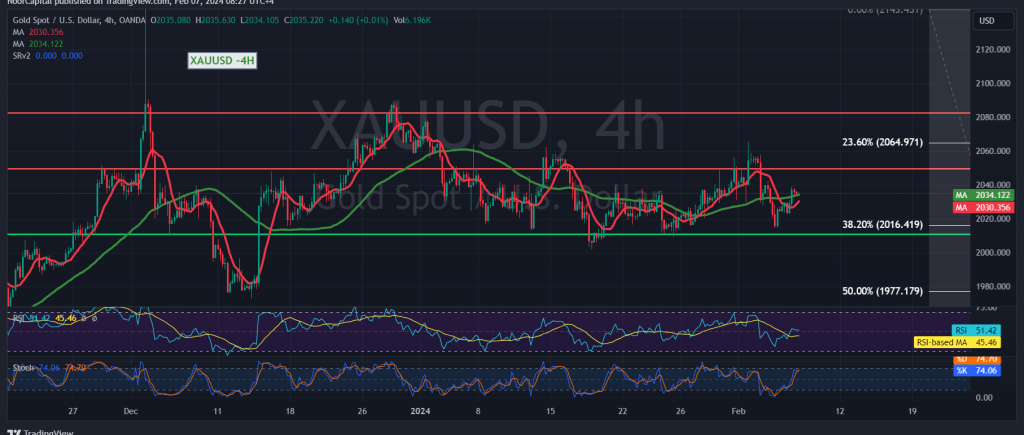
A detailed examination of the 240-minute timeframe chart reveals a nuanced technical landscape. The 50-day simple moving average exerts downward pressure on the price from above, signaling the prevailing bearish sentiment. However, intraday stability above the critical support level at 2024, and more broadly above the key floor of 2016, corresponding to the Fibonacci 38.20% retracement, suggests a potential for near-term recovery.
Path Forward: Positive Bias Amidst Key Breakout Levels
In light of these technical dynamics, a cautiously optimistic outlook is warranted. Consolidation above the resistance levels of 2035 and, more significantly, 2040, is pivotal. Such price action would serve as a catalyst for further upside potential, with initial targets set at 2047, followed by 2056 as the next official station in the bullish trajectory.
Overall Trend and Risk Considerations
Despite the modest upside attempts, the overarching upward trend remains intact, contingent upon stable trading above the critical support level at 2016. Conversely, a breach of this level would invalidate the bullish bias and pave the way for a substantial bearish correction, potentially targeting the vicinity of 1977.
Conclusion: Vigilance Amidst Uncertain Terrain
As gold prices navigate through a complex interplay of technical factors, traders are advised to exercise caution and closely monitor key breakout levels for decisive signals. While near-term upside potential exists, it is imperative to remain vigilant amidst the prevailing technical pressures. A breach of critical support or resistance levels could trigger significant directional shifts, warranting prudent risk management strategies.
Note: Trading on CFDs involves risks. Therefore, all scenarios may be possible. This article is not a recommendation to buy or sell but rather an explanatory reading of the price movement on the chart
| S1: |