
Gold (XAU/USD) prices faced significant selling pressure during the previous session, retreating toward the key support level of 4700 as the market attempts to stabilize following a recent downward correction.
Technical Outlook – 4-Hour Timeframe:
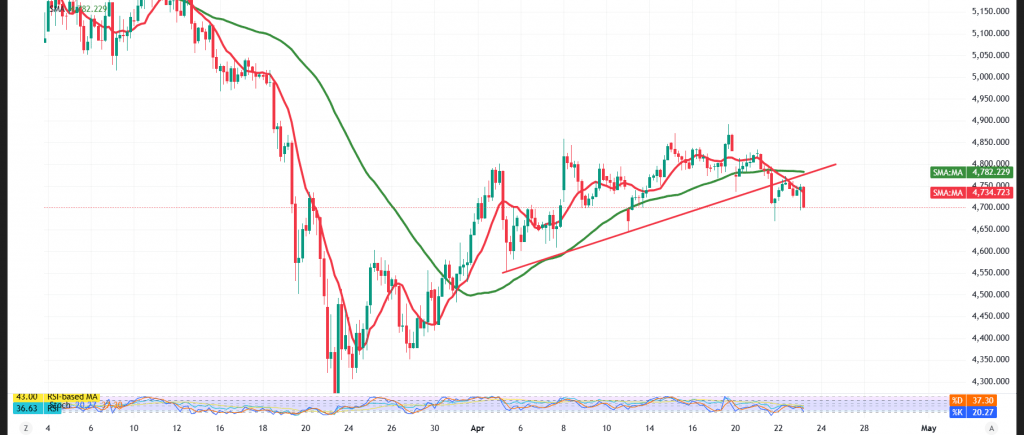
The intraday outlook remains cautious as trading continues below the simple moving averages, which are acting as dynamic resistance and reinforcing the bearish bias. This negative pressure intensified following the breach of a short-term corrective upward trendline, increasing the likelihood of further downside.
Meanwhile, the Relative Strength Index (RSI) continues to print negative signals after exiting overbought territory, reflecting persistent selling momentum.
Likely Scenario:
We prefer to monitor price action until a clearer trend emerges. The market is currently balanced between two primary paths:
- Bearish Scenario: A confirmed break and stability below 4695 could accelerate the decline, pushing prices toward 4675 as an initial target, followed by 4645.
- Positive Scenario: Conversely, if the price maintains its floor at 4700 and successfully reclaims the 4755 level, it could trigger a recovery toward 4800.
Note: Today, April 23, 2026, market participants are closely watching for updates on the U.S.-Iran ceasefire negotiations and high-impact Flash PMI data from the U.S. and Eurozone. Any shift in geopolitical risk or manufacturing sentiment could trigger significant volatility in gold.
Caution: The risk level is high amid ongoing trade and geopolitical tensions, and all scenarios remain possible. Trading gold involves high risk and may not be suitable for all investors.
Risk Disclaimer: Trading CFDs involves risks, and therefore all scenarios may be plausible. The content above is not a recommendation to sell or buy but rather an explanatory reading of price movement on the chart.
| S1: 4675.00 | R1: 4753.00 |
| S2: 4645.00 | R2: 4801.00 |
| S3: 4597.00 | R3: 4831.00 |


