
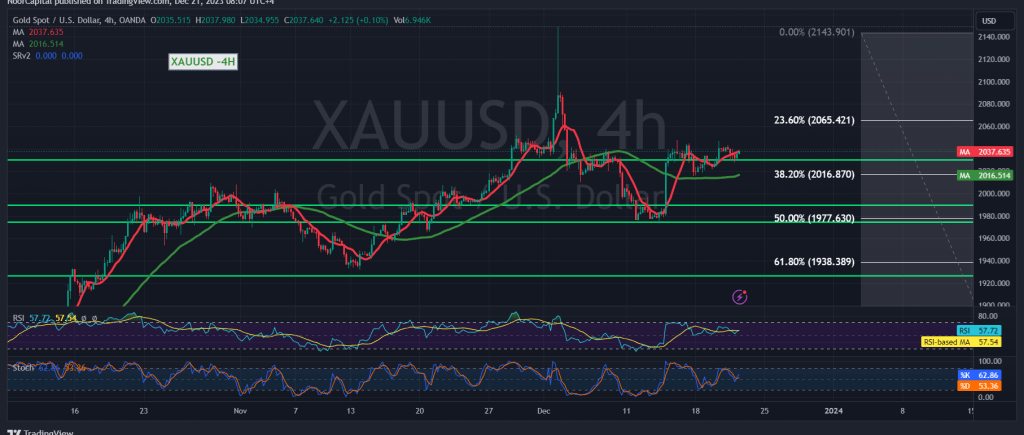
Gold prices experienced a temporary downturn following a formidable resistance encounter near 2044, compelling a negative trade that approached the support level highlighted in the preceding report at 2025. The lowest point was marked at 2027 before initiating renewed efforts toward an upward recovery.
Upon a detailed examination of the 4-hour timeframe chart, it is evident that gold has attained immediate stability above the 2034 resistance level. Overall, it remains secure above the pivotal 2016 level, constituting the 38.20% Fibonacci retracement and safeguarded by the ongoing support from simple moving averages. This setup augurs well for the potential resumption of an upward trajectory.
Hence, the bullish momentum remains both valid and potent. Notably, the consolidation above 2044 is a motivating factor amplifying the strength of the daily upward trend. Our expectations are set at 2051 initially, with further gains extending towards 2065.
It is imperative to note that a conclusive hour-candle closure below the 2016 38.20% Fibonacci retracement jeopardizes the activation of the bullish scenario, potentially ushering gold into a bearish correction, with projected targets around 2007 and 2000.
Cautionary Note: Today, heightened attention is warranted as we anticipate the release of impactful economic data from the American economy—the “final reading of gross domestic product” for the quarter. Consequently, we may observe heightened price volatility coinciding with the news release.
Risk Advisory: The current risk level is elevated.
Geopolitical Warning: Persistent geopolitical tensions contribute to a heightened risk environment, potentially resulting in increased price volatility. Exercise caution.
Note: Trading on CFDs involves risks. Therefore, all scenarios may be possible. This article is not a recommendation to buy or sell but rather an explanatory reading of the price movement on the chart.
| S1: |