
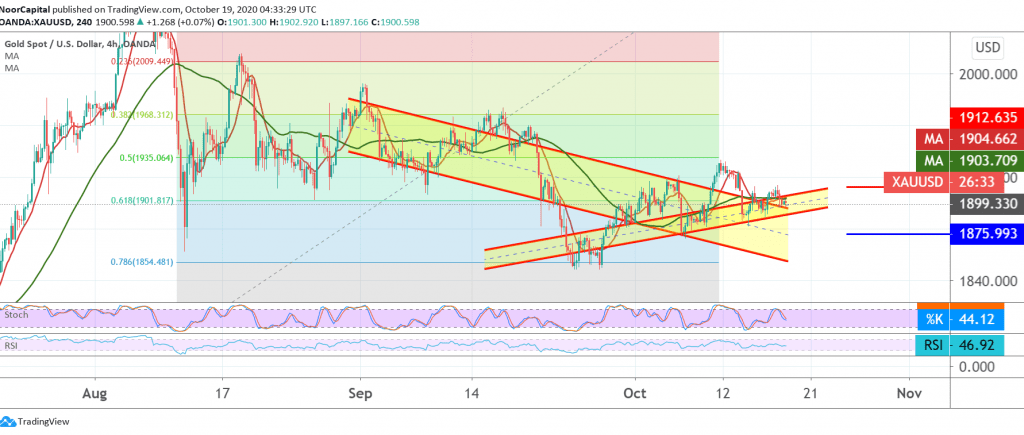
Gold prices opened the first session of the week with stability around the pivot level 1901. Technically, looking at the 4-hour chart, we see the SMA 50 attempts to pressure the price from the top, with the RSI tending to provide negative signals on short intervals, on the other side. Slight positive features started appearing on Stochastic.
Despite the technical factors supporting the occurrence of a bearish slope in the coming hours, we prefer to be neutral until the daily trend becomes clearer due to the contradiction in the technical signals, and therefore we are waiting for one of the following scenarios:
In order for a bearish trend, we need the price to stabilize below 1911/1910, with confirmation of the break of 1901, 61.80% correction, which puts the price under negative pressure, with targets around 1882 and 1875, respectively.
Activating long positions depends on confirming gold’s breach of 1912 resistance level, and the stability above motivates the chances of an advance towards 1927, then 1934, the 50.0% Fibonacci retracement.
| S1: 1894.00 | R1: 1910.00 |
| S2: 1887.00 | R2: 1921.00 |
| S3: 1877.00 | R3: 1928.00 |


