
Gold prices experienced a modest upward rebound in the last trading session, attempting to build on the previously established bottom around $2000. In our prior technical report, we highlighted that the consolidation of prices above 2016, and more significantly 2025, could potentially halt the possibility of a further decline.
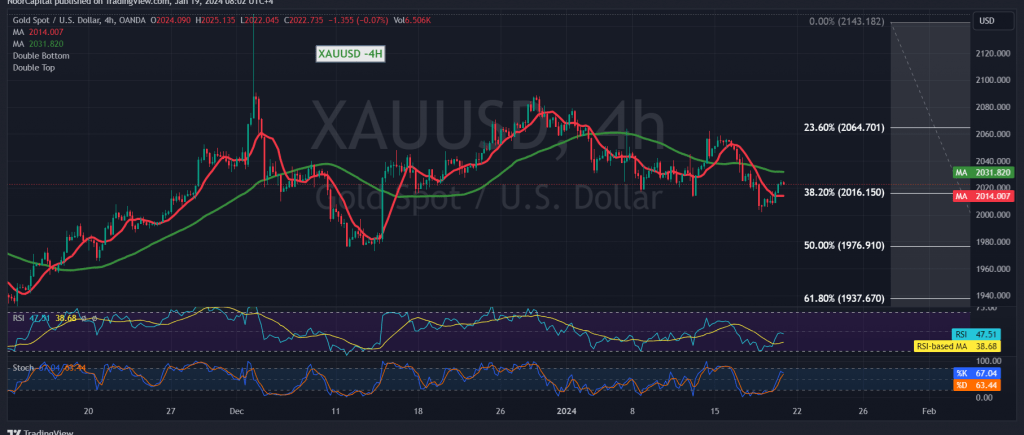
Examining the technical landscape today, and focusing on the 240-minute timeframe chart, we observe that the price has returned to stability above the 2016 support level, represented by the 38.20% Fibonacci retracement, signaling a positive trend. However, the 50-day simple moving average continues to act as a hindrance, limiting the potential for extended gains.
Given the presence of conflicting technical signals, we find it prudent to closely monitor price behavior for a strategic entry point, anticipating one of the following scenarios:
- Confirmation of the Upward Trend: To validate an upward trend, we need to witness intraday consolidation above 2016. Furthermore, a clear and robust breach of the 2029 resistance level would increase the likelihood of a temporary rise towards 2037 and 2049.
- Resumption of the Downward Trend: A decline below 2016, confirmed by the closing of at least a one-hour candle, renews the potential for a downward trend with initial targets at 2009 and an extension towards 2000. It’s worth noting that slipping below 1997 significantly amplifies and accelerates the strength of the downward trend, paving the way directly towards 1989.
Risk Warning: The level of risk is elevated. Given the ongoing geopolitical tensions, substantial price volatility is anticipated. Caution and prudent risk management are advised.
Note: Trading on CFDs involves risks. Therefore, all scenarios may be possible. This article is not a recommendation to buy or sell but rather an explanatory reading of the price movement on the chart
| S1: |