
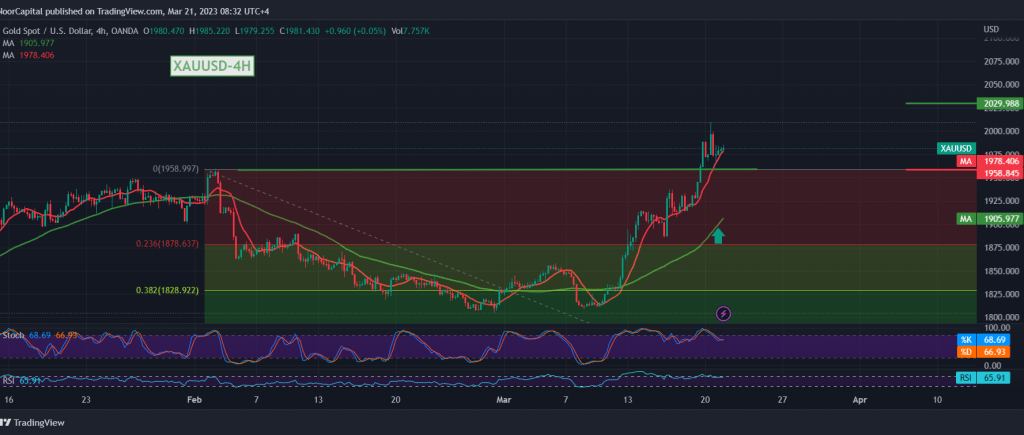
Gold prices continue to achieve successive increases to begin the first trading of this week on the rise, recording its highest level of $2009 per ounce, to begin a rapid decline to the downside, ending the previous session’s trading around 1978.
On the technical side today, a closer look at the 4-hour chart, with the continuation of the simple moving averages providing a positive impetus that supports the bullish curve of the prices and is stimulated by the positive signals of the stochastic.
From here, with steadfast daily trading above the previously breached resistance, which is now converted to the 1960 support level, the bullish trend remains the most likely, knowing that the breach of 2009 increases and accelerates the strength of the bullish trend, so that we are waiting for 2030 and 2040 as official waiting stations.
The price’s decline below 1960 is able to thwart the suggested bullish scenario, and we may witness a trading session in negative areas, and we await a retest of 1928 and 1917.
Note: The risk level may be high.
Note: Today we are awaiting the speech of the “European Central Bank Governor”, and we may witness high price fluctuations.
Note: Trading on CFDs involves risks. Therefore, all scenarios may be possible. This article is not a recommendation to buy or sell but rather an explanatory reading of the price movement on the chart.
| S1: |