
Negative pressure was experienced by the yellow metal prices at the beginning of this week’s trading, after it recorded its highest level during last week’s trading at around $1800 per ounce, to find a strong selling area that forced it to trade negatively.
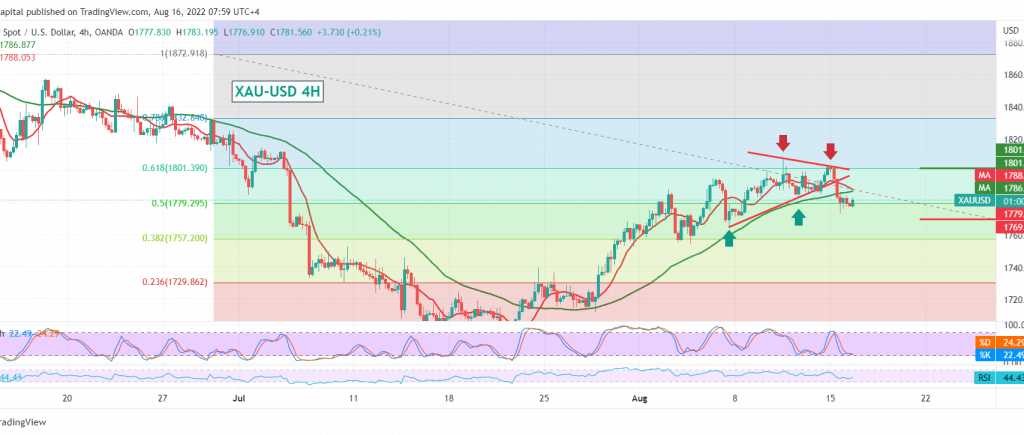
On the technical side, gold is now hovering around the bearish trend protection key at 1779, at 50.0% Fibonacci correction, as shown on the chart. 1786, knowing that consolidation above the mentioned level can consolidate gains again towards 1800.
We remind of the importance of the pivotal support area 1779, and breaking it and confirming the break will stop any attempts to rise, and gold will start forming a descending wave whose targets begin at 1756 and 1752.
Note: the simple moving average is still a negative pressure factor on the price.
Note: Trading on CFDs involves risks. Therefore, all scenarios may be possible. This article is not a recommendation to buy or sell but rather an explanatory reading of the price movement on the chart.
| S1: |