
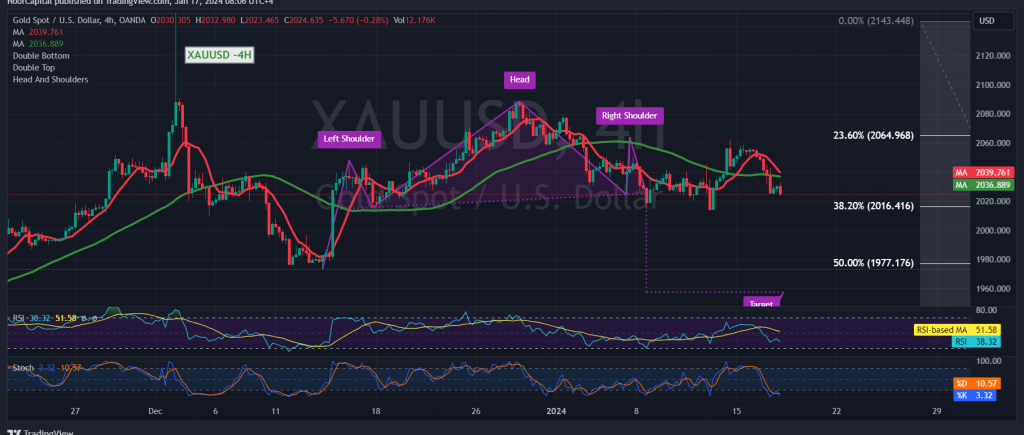
Gold prices experienced negative trading in line with the expected downward trajectory outlined in yesterday’s technical report, reaching the designated target at $2037 and marking a low at $2024 per ounce.
Analyzing the 4-hour chart today reveals stability in trading below the support level of 2037, with gold still under the influence of downward pressure from the simple moving averages.
Thus, our bearish expectations persist, with the next designated target being 2016, representing the 38.20% Fibonacci retracement. Caution is warranted, as a breach below the 2016 level could trigger a substantial decline, with initial targets around the $2000 mark.
On the flip side, a return to stability above $2045 would negate the proposed scenario, prompting a potential recovery in gold prices toward $2065 before the next price movement is determined.
Warning: The market awaits significant economic data today, including “retail sales” from the United States and “annual consumer prices” from the United Kingdom. Expect heightened price fluctuation at the time of the news release.
Note: Trading on CFDs involves risks. Therefore, all scenarios may be possible. This article is not a recommendation to buy or sell but rather an explanatory reading of the price movement on the chart
| S1: |