
Dow Jones Industrial Average (DJIA) Technical Analysis
The Dow Jones Industrial Average sustained significant losses on Wall Street, retreating sharply from a session high of 49,402 to register an intraday low of 46,678 — a steep decline that underscores the intensity of selling pressure across the index.
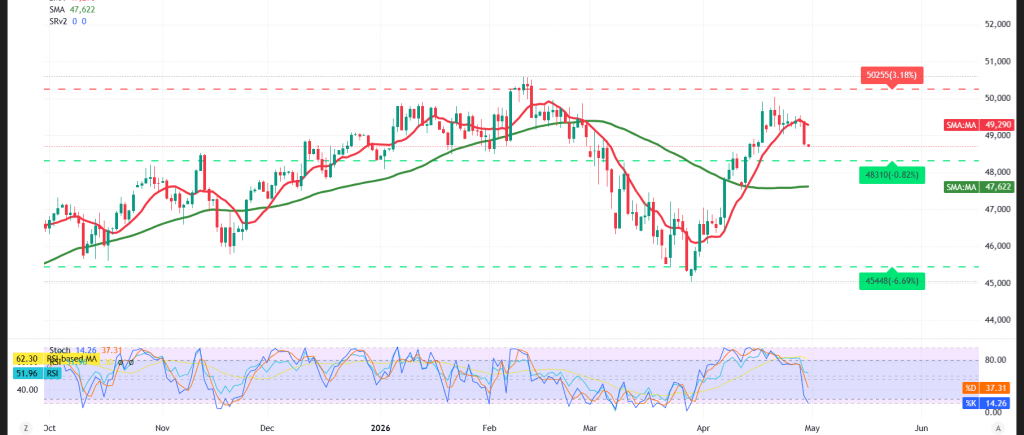
Technical Outlook for Today’s Session – 4-Hour Timeframe:
The Relative Strength Index (RSI) is broadcasting negative signals, holding firmly below the 50 midline — a reading that mirrors the persistent weakness in underlying momentum. Compounding the bearish picture, a bearish crossover has materialized on the simple moving averages, reinforcing the entrenched downtrend on the daily price action.
Most Likely Scenario:
From the current juncture, with the index pinned below the 49,000 resistance ceiling, the probability of a renewed downtrend remains firmly on the table, with 48,820 set as the initial target. A decisive break beneath this level would deepen the losses toward 48,730 as the subsequent objective.
It is worth highlighting that a recovery above the 49,000 threshold could ignite a swift rebound, paving the way toward 49,260 as an upside target.
Key Economic Events to Watch:
Today’s session features a heavy slate of high-impact economic releases from major economies, which are expected to materially influence market dynamics:
🇬🇧 United Kingdom:
- Interest Rate Decision
- Bank of England Monetary Policy Statement
- MPC Official Bank Rate Vote
🇪🇺 Eurozone:
- European Central Bank Monetary Policy Statement
- ECB Press Conference
🇺🇸 United States:
- Core PCE Price Index
- Advance GDP (Quarterly)
Risk Alert: Risk levels remain elevated amid persistent trade frictions and geopolitical tensions — all scenarios should be considered plausible.
Trading in CFDs involves risks, and therefore all scenarios are subject to potential outcomes. The analysis provided above is not a recommendation to buy or sell but rather an illustrative reading of price action on the chart.
| S1: 47135 | R1: 49860 |
| S2: 45545 | R2: 50990 |
| S3: 44410 | R3: 52580 |


