
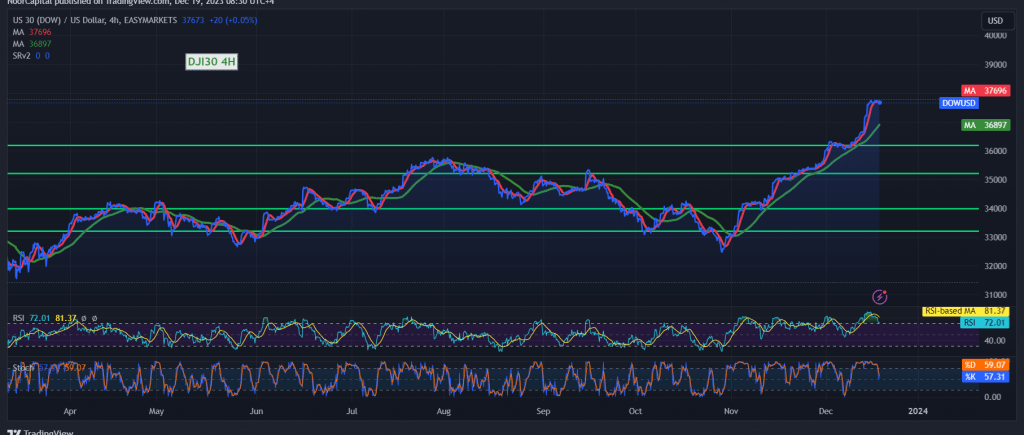
The Dow Jones Industrial Average on the Wall Street Stock Exchange continues to follow an upward general trend, marking the longest series of gains in over two years and reaching its peak at 37,772.
In today’s technical analysis, a closer examination of the 4-hour chart reveals that the simple moving average persists in guiding the price from below. This positive trend is further reinforced by the Relative Strength Index defending the upward trajectory.
Consequently, the prevailing outlook leans towards a bullish scenario in today’s trading session, contingent upon daily trading remaining above 37,620. The initial target is set at 37,750, and a breach of this level would intensify and accelerate the strength of the upward trend, opening the path for further gains towards 37,830 and 37,880. Subsequent gains may extend towards 38,100.
It is crucial to note that a dip below the support level of 37,600 would temporarily exert negative pressure on the index, with the initial downside target being a retest of 37,560 before a potential rebound.
Warning: The Stochastic indicator hints at a negative trend, and some price fluctuation may occur until an official trend is established.
Warning: The level of risk is deemed high, particularly in the face of ongoing geopolitical tensions, and increased price volatility may be observed. Prudence and careful risk management are recommended.
Note: Trading on CFDs involves risks. Therefore, all scenarios may be possible. This article is not a recommendation to buy or sell but rather an explanatory reading of the price movement on the chart.
| S1: |