
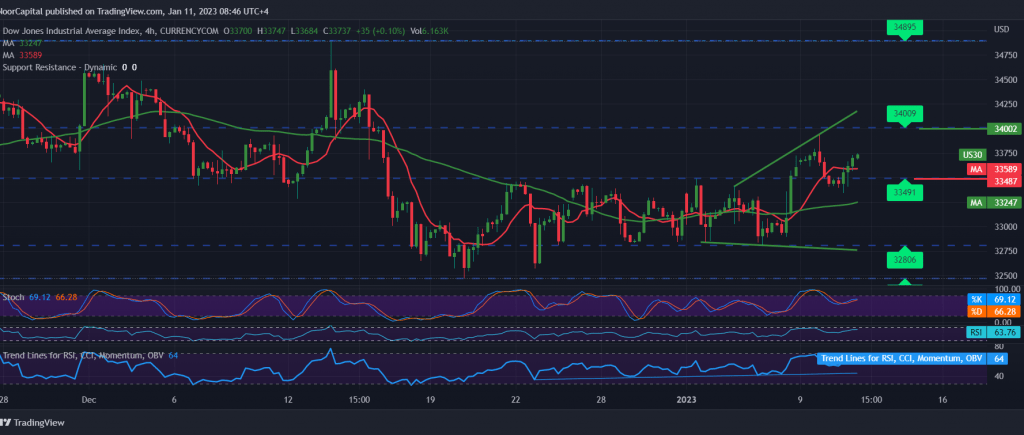
During the previous technical report, the Dow Jones Industrial Average reversed the expected bearish path. We relied on trading remaining below the resistance of 33,490 when writing the report. As a reminder, we indicated that consolidation above 33,490 leads the index to recover to visit 33,710, recording its highest level at 33,747.
Technically, we tend to be positive, but with caution, relying on the index receiving a positive impulse from the 50-day simple moving average and obtaining positive signals from the relative strength index.
From here, with steady daily trading above the previously breached resistance, which is now transformed into the support level of 33,490, the bullish bias is the most favorable, targeting 33,870, and breaching it increases and accelerates the strength of the bullish daily trend, opening the door for 34,000.
Note: Trading on CFDs involves risks. Therefore, all scenarios may be possible. This article is not a recommendation to buy or sell but rather an explanatory reading of the price movement on the chart.
| S1: |