
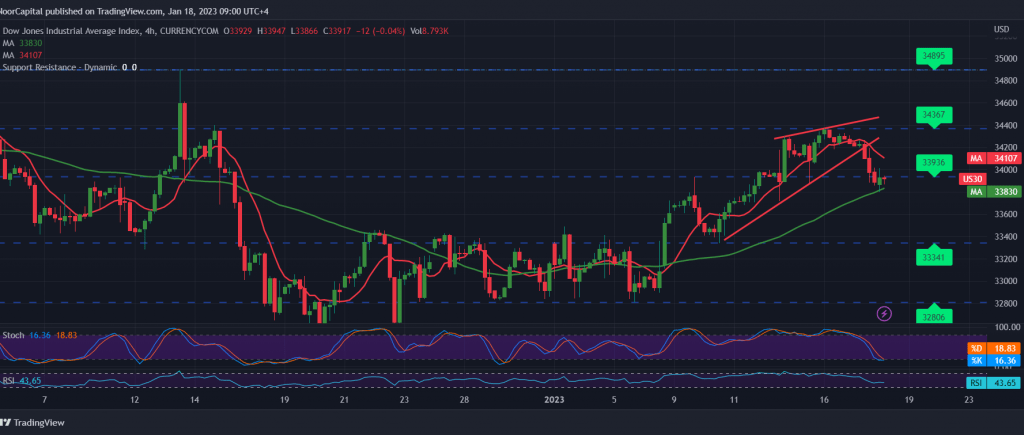
The Industrial Dow Jones Index declined on Wall Street yesterday to reflect the expected bullish trend, in which we relied on trading stability above 33,380, explaining that breaking the mentioned level leads the index to retest the main support of 34,180, before attempting to rise again, recording its lowest level at 33,800.
On the technical side today, the index failed to maintain its trading above 34,180, in addition to the clear negative signs on the RSI and its stability below the midline 50.
We may witness a downward trend with intraday trading stability below 34,180, provided that we witness a clear and strong break of the support level of 33,800, which puts the index under strong negative pressure, targeting 33,710.
ConsolidatIon above 34,180, lead the index to recover temporarily to retest 34,210.
Note: The level of risk is high.
Note: High-impact data are due today in the US, Retail Sales and US Producer Prices and may cause some volatility.
Note: Trading on CFDs involves risks. Therefore, all scenarios may be possible. This article is not a recommendation to buy or sell but rather an explanatory reading of the price movement on the chart.
| S1: |